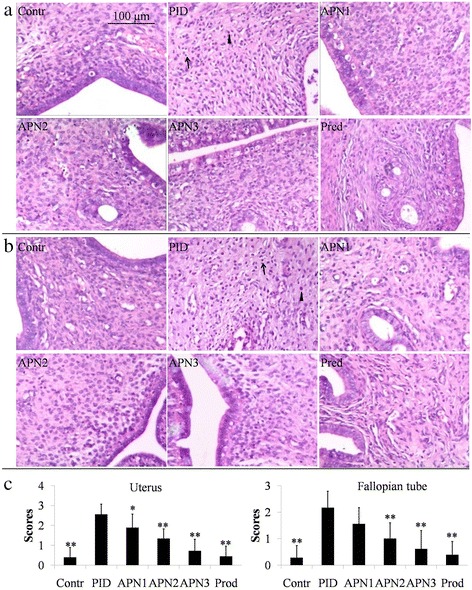
Fig. 1.

Effect of APN on pathogen-induced infiltration of neutrophils and lymphocytes in uterus and fallopian tube. Representative micrographs of uterus a and fallopian tube b stained with H & E are showed at a magnification of × 100. The infiltration of neutrophil is indicated as ▲, and the infiltration of lymphocyte is indicated as ↑. c Histological semi-quantitative scores of inflammatory cell. Each bar represents the mean ± SD (*P < 0.05, **P < 0.01, significantly different from PID group; n = 6). Contr and Pred represent control group and prednisone group, respectively
