Fig. 2.

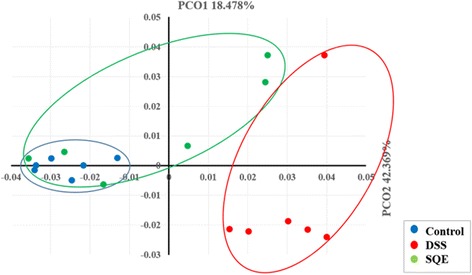
Principal coordinate analysis (PCoA) plot. PCoA was used to determine clustering patterns among the control, DSS, and SQE groups (n = 6 mice/group). Similarities between the communities were calculated by employing Fast UniFrac analysis

Principal coordinate analysis (PCoA) plot. PCoA was used to determine clustering patterns among the control, DSS, and SQE groups (n = 6 mice/group). Similarities between the communities were calculated by employing Fast UniFrac analysis