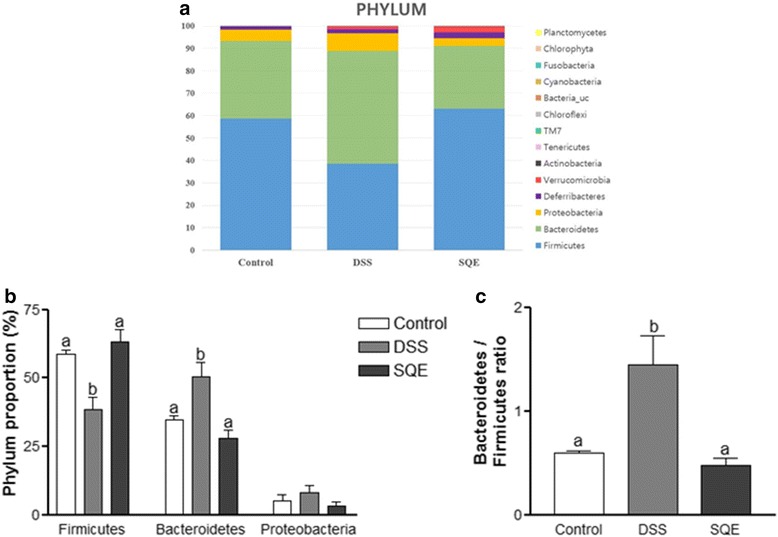
Fig. 3.

Composition of the gut microbiota at the phylum level. a The composition of gut microbiota at the phylum level. b, c Changes in the proportion of major class (b) and minor class (c) bacterial at the phylum level among the control, DSS, and SQE groups. c Relative abundance of phylum level of minor proportion of bacteria in control, DSS, and SQE group. Data shown are the means ± SEM and were analyzed by one-way ANOVA and Newman-Keuls’s post hoc test (p < 0.05); n = 6 mice per group
