
Fig. 4.
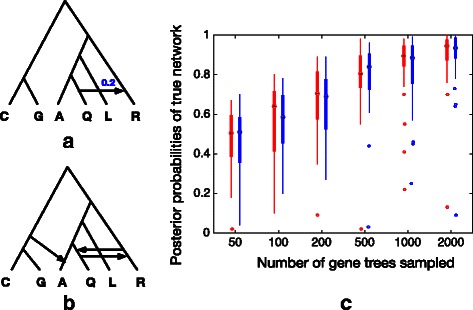
Simulation study 2. a The true species phylogeny (a network with one reticulation) with all internal branches set to 1 coalescent unit and inheritance probability set to 0.2. b The species network fed into our method. c The results where red boxes represent results from using true gene trees and blue boxes represent results from using reconstructed gene trees