
Fig. 5.
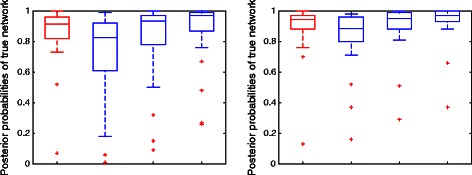
Using pseudo-likelihood versus full-likelihood. Left and right panels correspond to results of case 1 (Fig. 3) and case 2 (Fig. 4), respectively. For both, 2000 true gene trees were used. In each panel, red box represents results from using full-likelihood when threshold 0.01 was used to prune networks. Blue boxes represent results from using pseudo-likelihood, while three blue boxes from left to right correspond to using threshold 0.01, 0.015 and 0.02, respectively, to prune networks