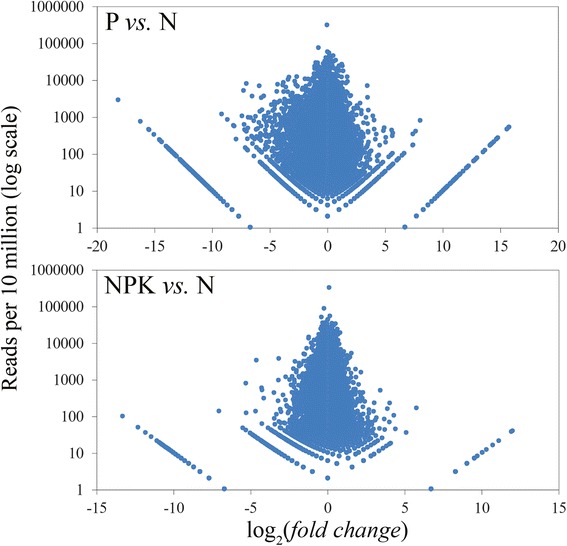
Fig. 1.

Relative and absolute expression levels of genes in plants grown under phosphate deficiency (P vs. N) or excess nutrition (NPK vs. N). High-throughput sequencing data. Each point represents the data for one gene. Y-axis – the sum of normalized reads in normal (N) and nutrient stress (P or NPK) conditions
