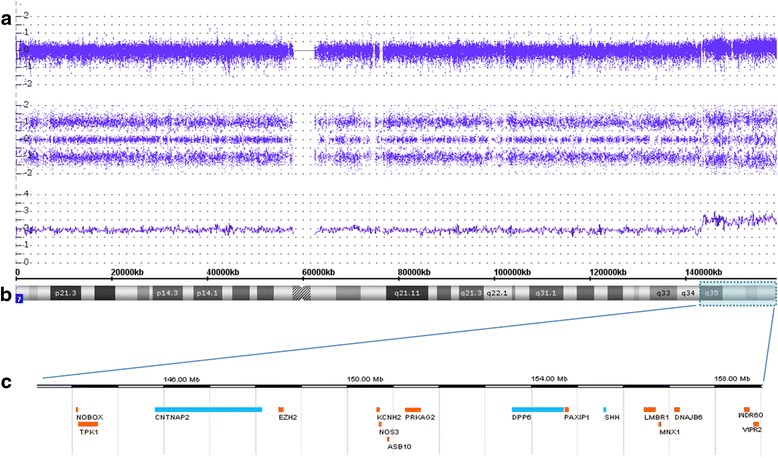
Fig. 3.

SNParray profile for chromosome 7. a Copy number probe intensities (log2 ratio) are represented in the upper track, allele peak tracks in the middle and smooth signal below indicating a mosaic gain. b Chromosome 7 ideogram showing the tetraplicated region (blue box); c OMIM genes associated to disorder present in the aSMC: In blue = more potentially implicated in phenotype; In orange = apparently not related to phenotype
