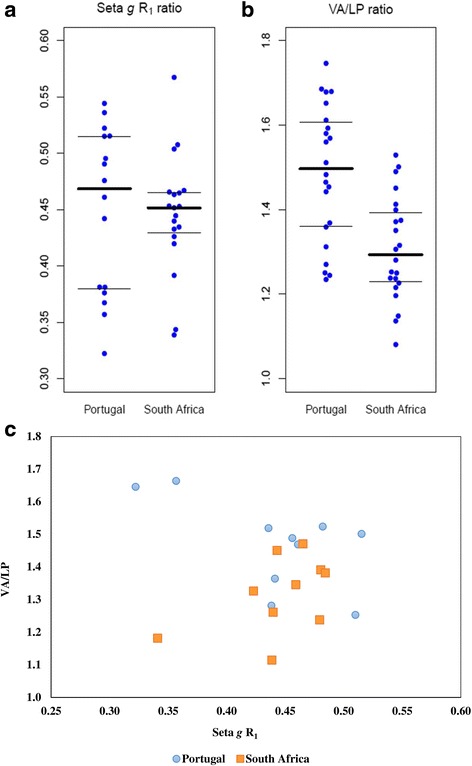
Fig. 3.

Beeswarm scatter plots (a, b), and Scatter diagram (c). Gonocoxite’s leaflet or seta g R1 ratio [10] (a) and phallosome’s ratio of the length of the ventral arm (VA) over the width of the lateral plate (LP), at the point of attachment of the former, VA/LP, from Portuguese and South African mosquitoes (b). All ratios for individual structures are plotted. The horizontal lines show the 25, 50 and 75% quartiles. Scatter diagram of g R1 ratio versus VA/LP ratio of mean values for each specimen (c)
