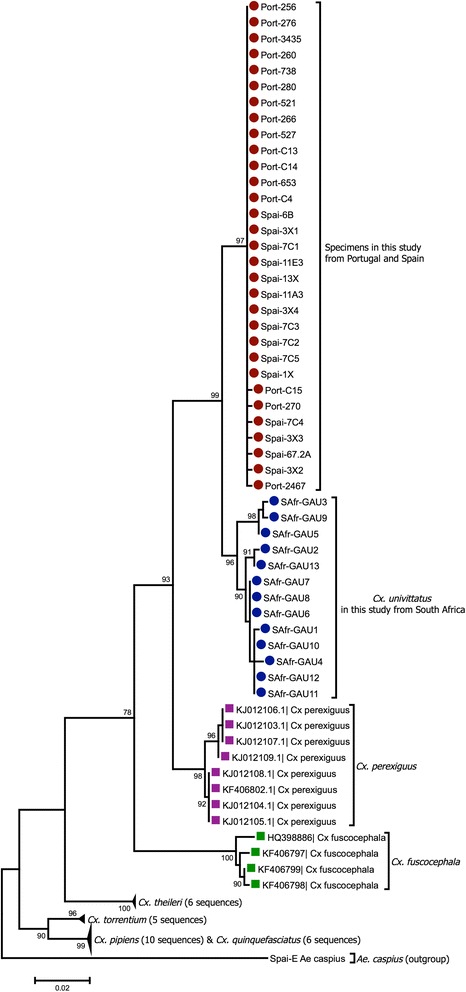
Fig. 4.

Phylogenetic analysis by Maximum Likelihood. The tree with the highest log likelihood (-2167.4061) is shown. The size bar indicates 0.02 substitutions per site. The analysis involved 84 nucleotide sequences, with a total of 637 positions in the final dataset. The tree has been rooted using Ae. (Och) caspius as the outgroup. Abbreviations: SAfr, South Africa; Port, Portugal; Spai, Spain
