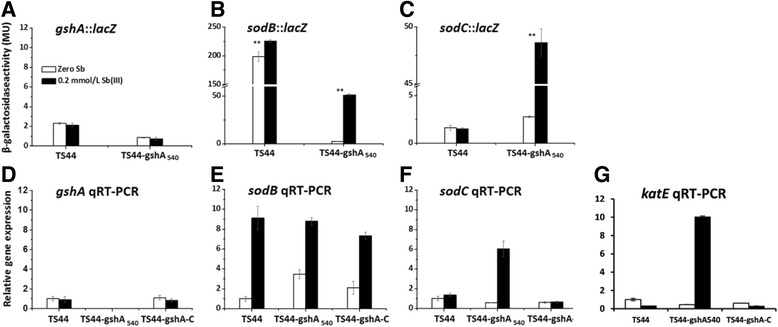
Fig. 4.

The effect of Sb(III) to the transcription of gshA, sodB, sodC and katE. The transcription of gshA, sodB and sodC was tested by a lacZ reporter fusion and qRT-PCR, while the katE transcription was only tested by qRT-PCR. For lacZ reporter fusion (a, b and c), data are expressed as the mean ± SD, N = 3. **Indicates a significant difference from the control (p < 0.01). For qRT-PCR, error bars correspond to the standard deviations of the means from three biological replicates. Gene expression was normalized to the 16S rRNA gene. The results are presented as the mean gene expression normalized to mRNA levels in Sb(III)-free CDM. Data symbols shown in all panels are the same
