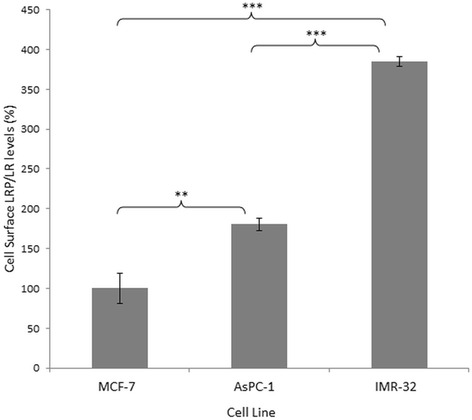
Fig. 3.

Quantification of cell surface LRP/LR levels on pancreatic cancer (AsPC-1) and neuroblastoma (IMR-32) cells. The cells were labelled with the primary IgG1-iS18 antibody and the anti-human phycoerythrin (PE) secondary antibody. 20 000 cells were analysed across all three cell lines, with the median fluorescence intensity analysed as an indicator of the cell surface LRP/LR levels. In comparison to the MCF-7 control cell line, AsPC-1 cells exhibit an approximate 2-fold increase in cell surface LRP/LR whilst the IMR-32 cells exhibit an approximate 4-fold increase in cell surface LRP/LR. This data is representative of three experimental triplicates. The MCF-7 values were set to 100%. The error bars represent standard deviation and p-values *p ≤ 0.05, **p ≤ 0.01, ***p ≤ 0.001
