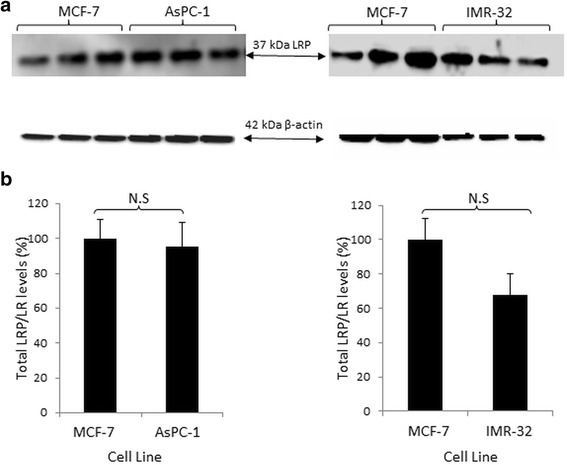
Fig. 4.

Detection of total LRP levels in pancreatic cancer (AsPC-1) and neuroblastoma (IMR-32) cells. a Western blot analysis was performed to detect total 37-kDa LRP levels in all three cancer cell lines. β-actin was used as a loading control. b Densitometric quantification performed on these blots revealed that there was no significant difference in total LRP/LR levels between the poorly invasive MCF-7 cells and the two experimental cell lines: AsPC-1 and IMR-32. This data is representative of an average of three experiments. The values obtained from quantification of LRP were divided by the values obtained from β-actin quantification and the resultant values were used to construct the above graph. The MCF-7 values were set to 100%. The error bars represent standard deviation and Non-significant (N.S) p-value: p > 0.05
