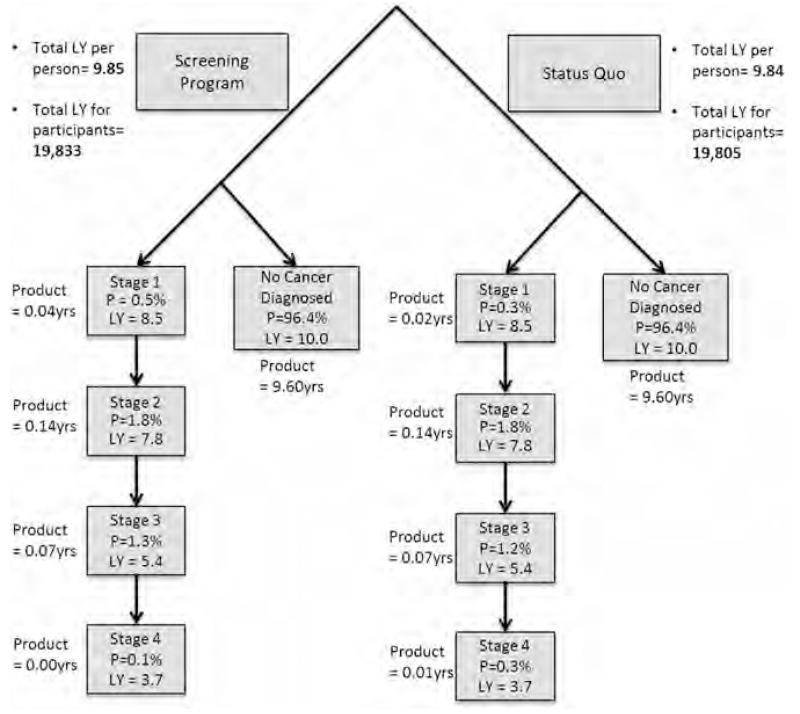
Fig. 1.
Probabilities and discounted life-years for each cancer stage for women with and without screening program. LY, expected life-years remaining for each stage of cancer, discounted by 3% each year following; P, probability distribution of each cancer stage; total LYs for participants, overall weighted LYs for entire study participants with screening and without screening program, calculated by total LYs per person × total number of participants; total LYs per person, overall weighted LYs per person, calculated by aggregating the product of each stage (P × LY).

