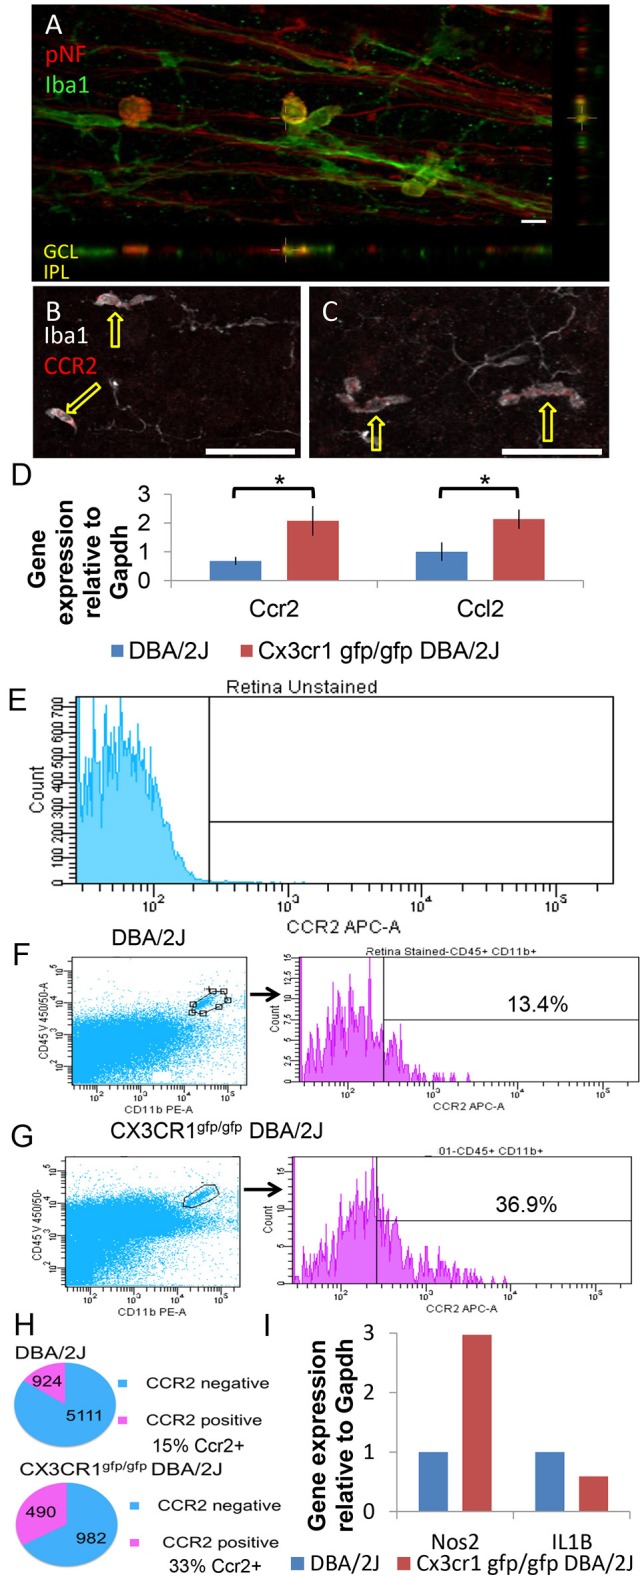
Figure 6.

Amoeboid Iba1+ cells are peripherally derived macrophages. (A) Amoeboid Iba1+ cells localize to the neurofibrillary layer. Volume view of a DBA/2J retinal whole mount stained for the axonal marker pNF (red) and the microglia/macrophage marker Iba1 (green). Orthogonal views shown below and to the right. Amoeboid Iba1+ cells showed non-specific reactivity with the donkey anti-mouse secondary antibody used to detect pNF (not shown). (B) Single z-plane (0.8 μm) from a control DBA/2J retinal whole mount immunostained for the peripheral macrophage marker Ccr2 (red) and Iba1 (white). The amoeboid shaped Iba1+ cells are positive for Ccr2 (arrows) while branched Iba1+ cells are negative. (C) Single z-plane (0.8 μm) from a Cx3cr1gfp/gfp DBA/2J retina immunostained for the peripheral macrophage marker Ccr2 (red) and Iba1 (white). As in (B) the amoeboid shaped Iba1+ cells are positive for Ccr2 (arrows) while branched Iba1+ cells are negative. (D) There is significantly more expression of Ccr2 and Ccl2 in Cx3cr1gfp/gfp DBA/2J whole retina cDNA (3 and 2-fold more expression respectively, *p < 0.05; Student's t-test; error bars represent the SEM, 5 retinas per condition). (E) Gating parameters were set by dissociated retinal cells not exposed to antibodies. 56,935 viable cells collected. (F) Left, representative plot of DBA/2J assessing CD45+ CD11b+ (gate shown) from 129,000 to 200,000 viable cells. Right, histograms and percent CCR2+ of gated CD45+CD11b+ population. (G) Left, representative plots of Cx3cr1gfp/gfp DBA/2J assessing CD45+ CD11b+ (gate shown) from 129,000 to 200,000 viable cells as in F. Right, histograms and percent CCR2+ of gated CD45+CD11b+ population. (H) Top, total number and percent of CCR2+ and CCR2− of all CD45+CD11b+ cells analyzed by flow cytometry in DBA/2J n = 8 pooled retinas (293,780 cells collected). Bottom, total number and percent of CCR2+ and CCR2− of all CD45+CD11b+ cells analyzed by flow cytometry in Cx3cr1gfp/gfp DBA/2J n = 6 pooled retinas (453,727 cells collected). (I): There is ~3-fold more expression of Nos2 but 33% less expression of IL1β in FACS sorted myeloid cells (n = 8 DBA/2J pooled retinas and n = 6 CX3CR1gfp/gfp DBA/2J pooled retinas). Scale bars: 50 μm (B,C) 10 μm (A).
