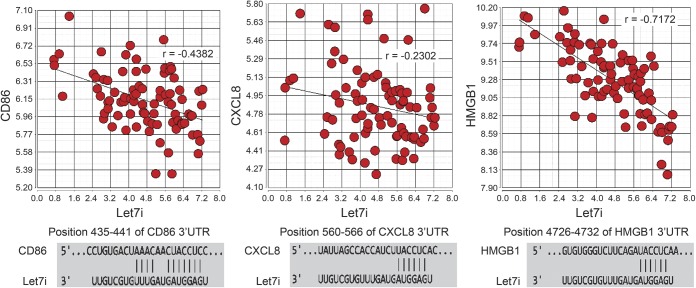
Figure 2. Correlation of let7i with gene targets CD86, CXCL8, HMGB1 in circulating leukocytes of patients with acute ischemic stroke.
The y-axis is the relative expression of messenger RNA transcript based on normalized intensity values from the Human Transcriptome Array 2.0 Affymetrix microarray. The x-axis is the relative expression of let7i based on delta Ct values from TaqMan reverse transcription PCR. As let7i decreased, levels of CD86, CXCL8, and HMGB1 increased suggesting a regulatory effect of let7i for these targets in ischemic stroke. The binding site of let7i in the 3′UTR of CD86, CXCL8, and HMGB1 is shown below each scatterplot. 3′UTR = 3′ untranslated region.

