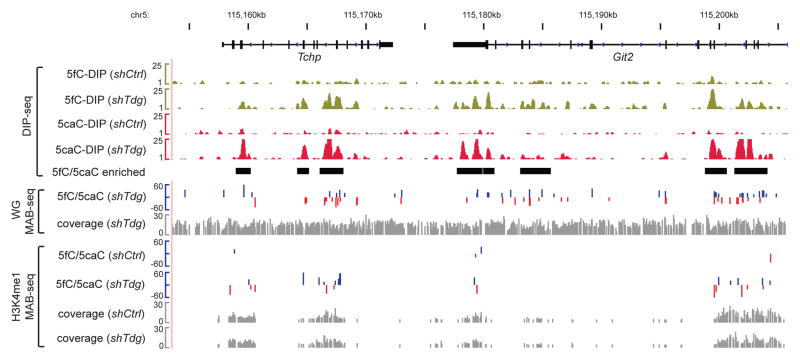
Figure 5. Base-resolution 5fC/5caC maps and affinity-enrichment-based 5fC/5caC maps at the Tchp-Git2 locus in mouse ES cells.
For WG-MAB-seq or H3K4me1-MAB-seq datasets, positive values (blue) indicate CpGs on the Watson strand, whereas negative values (red) indicate CpGs on the Crick strand (vertical axis limits are −60% to +60%). Only CpGs sequenced to depth 5 and associated with statistically significant level of 5fC/5caC (FDR=5%) are shown. Sequencing coverage for WG-MAB-seq or H3K4me1-MAB-seq is shown in gray in separate tracks (vertical axis limits are 0 to 30 reads). Highlighted by black horizontal bars are 5fC/5caC-enriched genomic regions identified by DNA immunoprecipitation following by sequencing (DIP-seq). The vertical axis limits for DIP-seq datasets are 1 to 25 (in rp10m: reads per 10 million reads). shCtrl, control knockdown mouse ES cells; shTdg, Tdg knockdown mouse ES cells.

