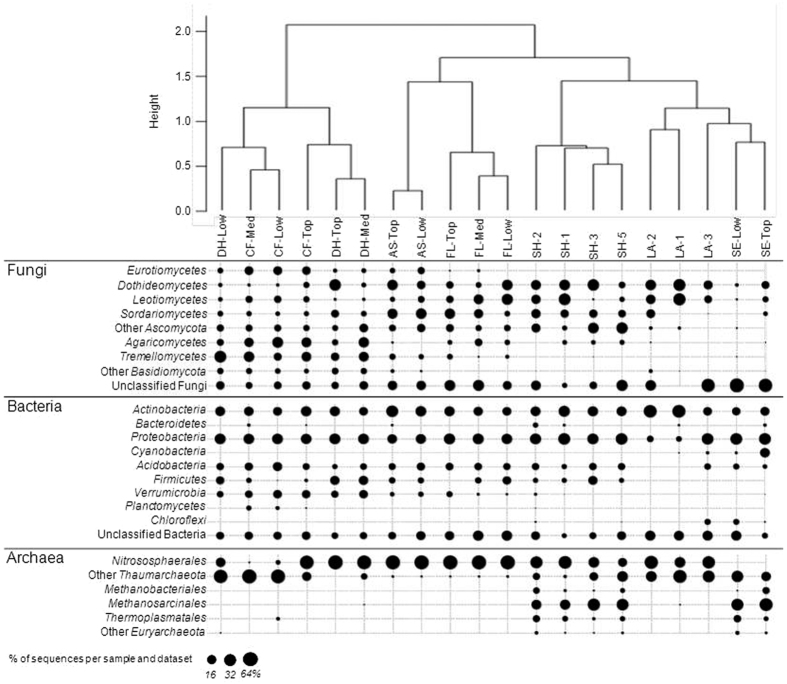
Figure 2. Similarity of community composition as revealed by hierarchical clustering of the distribution of the main OTUs with a dot plot indicating the relative abundance of the main microbial taxa at different depths in the environmental samples: Dry hill (DH), Conifer forest (CF), Flooded area (FL), Shore (SH), Agricultural soil (AS), lake side (LA-1), Lake surface (LA-2), 10 m depth lake (LA-3), Sediments at the lake side (SE-Top) and in the middle of the lake (SE-Low).
Each sample corresponds to the averages of the biological triplicates (Fig. S2).

