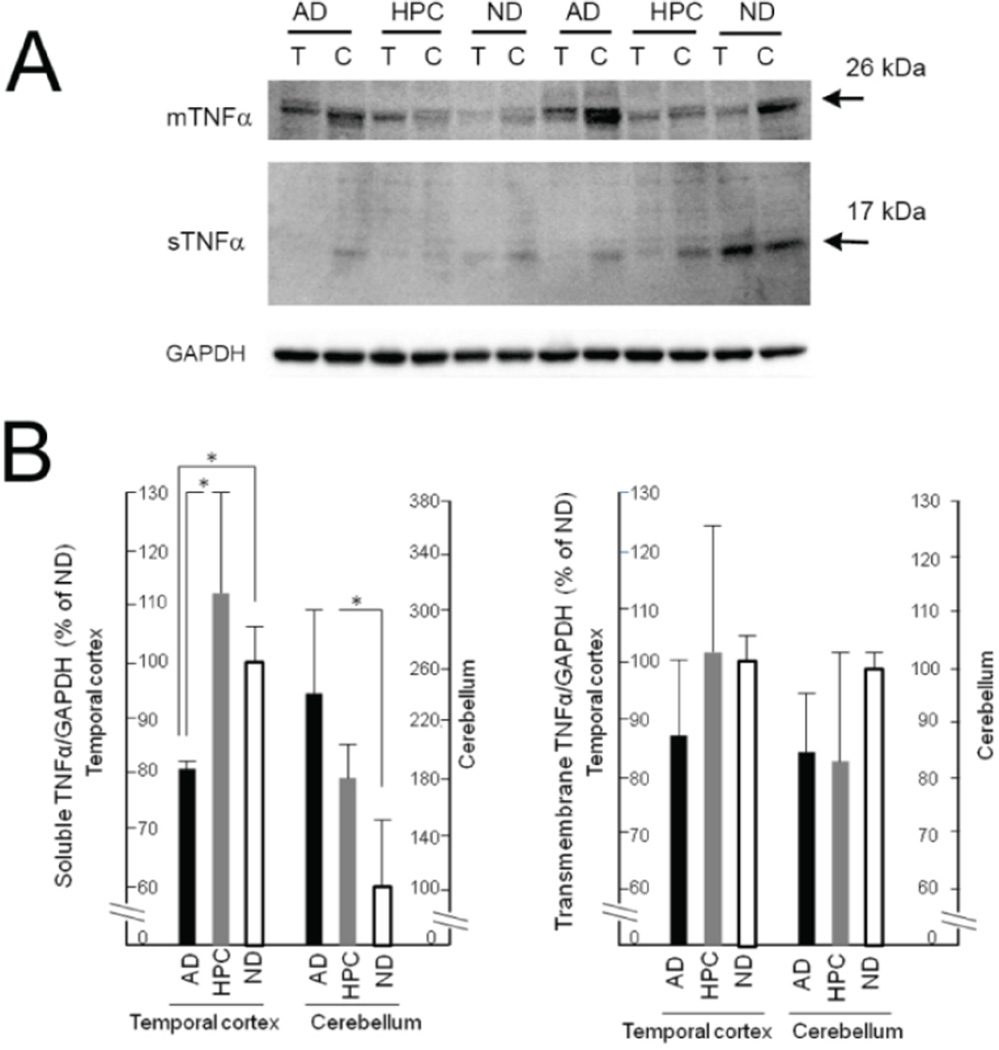
Figure 1.
TNFα protein levels in the temporal cortex and cerebellum of the AD, HPC and ND Brain. (A) Representative images of soluble TNFα (sTNFα) and transmembrane TNFα (mTNFα) protein bands at approximately 26 kDa and 17 kDa, respectively, from Western blots. T: Temporal cortex; C: Cerebellum; GAPDH: Glyceraldehyde-3-phosphate dehydrogenase. (B) Densitometry analysis of sTNFα and mTNFα protein expression in the AD, HPC and ND brain. Data on the protein levels of sTNFα and mTNFα were normalized to GAPDH. Subsequently, the normalized data of AD and HPC groups were compared with ND group, and expressed as relative expression levels, where the data on ND were set as 100%. Values are expressed as the mean ± S.D. of the relative expression levels. n=5, *p<0.05 by Kruskal-Wallis non-parametric analysis with Steel-Dwass post-testing.

