-
A
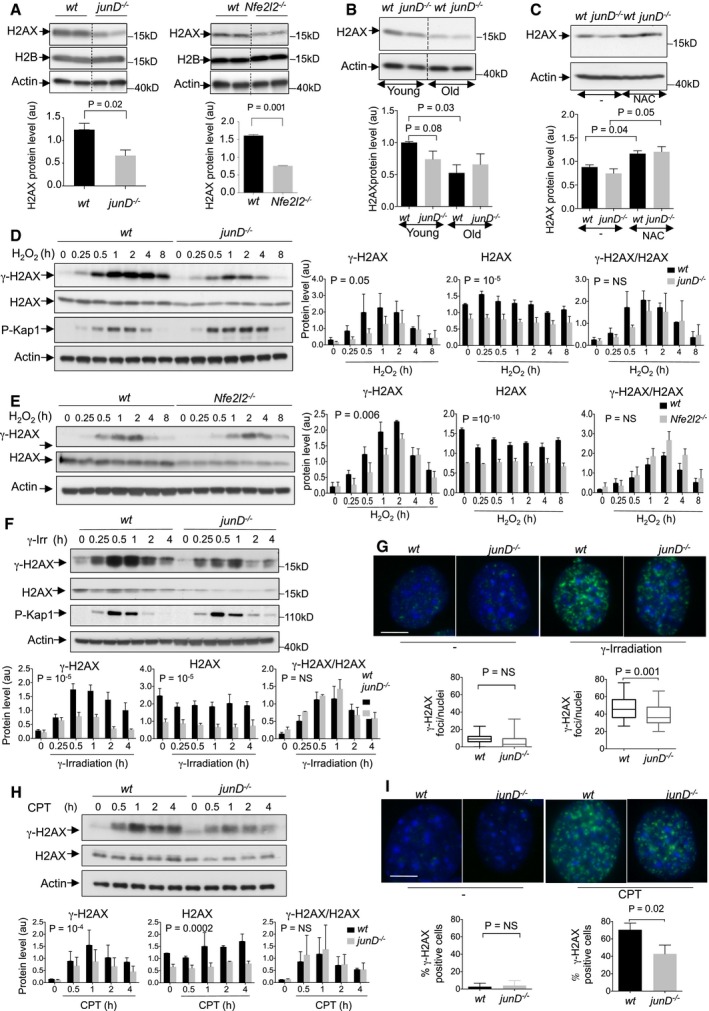
(up) Representative Western blot from whole cell extracts showing H2AX protein levels in wt and junD
−/− fibroblasts (left) or in wt and Nfe2l2
−/− fibroblasts (right). Two representative clones, with their corresponding controls, are shown per genotype. H2B was used as negative control. (down) Bar plot showing H2AX protein levels as assessed by densitometry analysis of Western blots (as shown above). n ≥ 3 independent experiments.
-
B
(up) Representative Western blot from kidney whole cell extracts showing H2AX protein levels in age‐matched wt and junD
−/− mice. Mice are 2 months old (young) and 18 months old (old), respectively. (down) Bar plot showing H2AX protein levels as assessed by densitometry analysis of Western blots (as shown above). N ≥ 5 mice per age and per genotype.
-
C
(up) Representative Western blot from kidney whole cell extracts, showing H2AX protein levels in 24 months old wt and junD
−/− mice, either untreated (−) or treated with the antioxidant agent, N‐acetyl‐cysteine (NAC). (down) Bar plot showing H2AX protein levels as assessed by densitometry analysis of Western blots (as shown above). N ≥ 4 mice per treatment and per genotype.
-
D, E
(left) Representative Western blots from whole cell extract showing γ‐H2AX, H2AX protein levels and Kap1 phosphorylation (P‐Kap1) in wt and junD
−/− fibroblasts (D) or in wt and Nfe2l2
−/− fibroblasts (E), after H2O2 exposure for the indicated times (hours, h). (right) Bar plots showing γ‐H2AX and H2AX protein levels, as well as γ‐H2AX/H2AX ratio as assessed by densitometry analysis of Western blots (as shown on the left). n = 3 independent experiments.
-
F, H
(up) Representative Western blots from whole cell extract showing γ‐H2AX, H2AX protein levels and P‐Kap1 in wt and junD
−/− fibroblasts, following 2 Gy of γ‐irradiation (F) or after camptothecin (CPT) treatment (H) for the indicated times (hours, h). (down) Bar plots showing γ‐H2AX and H2AX protein levels, as well as γ‐H2AX/H2AX ratio as assessed by densitometry analysis of Western blots (as shown upper). n = 3 independent experiments.
-
G, I
(up) Representative γ‐H2AX immunofluorescence (green) in wt and junD
−/− fibroblasts before (−) or after γ‐irradiation (2 Gy, 45 min) (G) or after camptothecin (CPT) treatment for 1 h (I). Blue signal corresponds to DAPI staining. (down) box‐plots of large γ‐H2AX foci per nuclei (diameter > 0.8 μm). At least 50 nuclei per genotype have been used for quantification.
Data information: For all panels, data are shown as means ± SEM.
P‐values are based on Student's
t‐test (A–C, G and I).
P‐values show the difference between
wt and
junD
−/− or between
wt and
Nfe2l2
−/− fibroblasts across time points and are based on paired
t‐test (D–F and H). Actin is used as internal control for protein loading (A–F and H). NS stands for not significant and * stands for
P‐value = 0.01. Scale bars = 10 μm. a.u. stands for arbitrary unit.
Source data are available online for this figure.