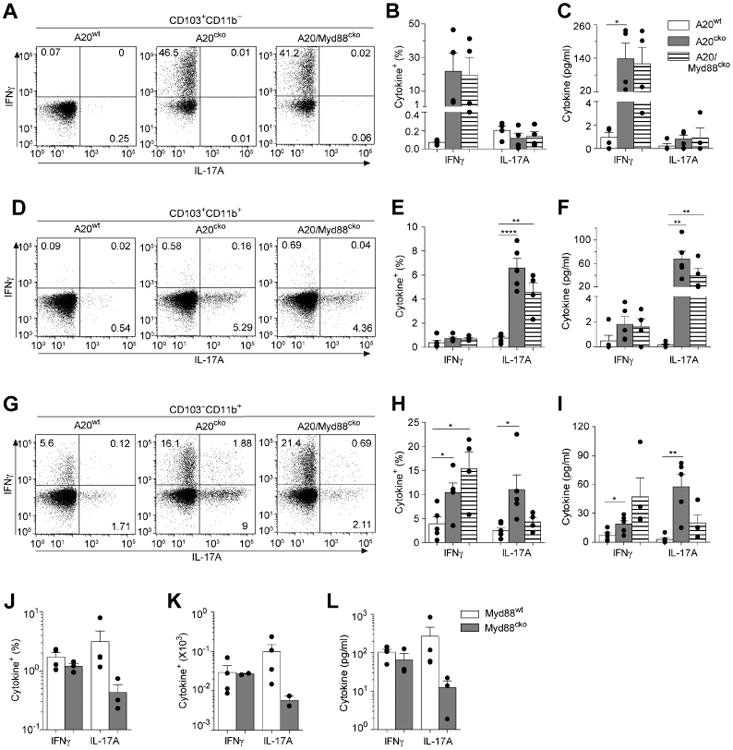
Figure 4. Each SI-LP DC subset possesses unique APC functions, and differential requirements for MyD88 signals.

SI-LP CD103+CD11b− DCs were isolated from mice of the indicated genotype and co-cultured 1:1 with naïve OT-II T cells for 4 days. (a) Representative flow plots of IFNγ+ and IL-17+ T cells in each CD103+CD11b− DC–T cell co-culture. The percentages of IFNγ+ or IL-17+ CD4 T cells (b) and ELISA quantification of IFNγ and IL-17 protein (c) in co-cultures of CD103+CD11b− DCs from A20wt, A20cko and A20/Myd88cko mice. OT-II co-cultures with CD103+CD11b+ DCs (d-f) or CD103−CD11b+ DCs (g-i) were assayed as above. Data are combined from 3 independent experiments. Each dot represents one experiment, or replicates within an experiment, using DCs pooled from at least 3 mice of each genotype, and including all 3 genotypes for each experiment. (j-k) CD103−CD11b+ DCs isolated from co-housed Myd88wt and Myd88cko mice were co-cultured with naïve OT-II T cells, as above. The percentages (j) and total cell number (k) of IFNγ+ or IL-17+ T cells, or IFNγ or IL-17A protein in culture supernatant (l) assayed from two independent experiments, with at least 5 mice per genotype, and including both genotypes for each experiment. Each dot represents replicates within an experiment. Error bars represent mean ± SEM, *, P < 0.05, **, P < 0.01, ****, P < 0.0001, (unpaired student's t-test). See also Figure S4.
