
Figure 1. Rad4-Rad23 Crystal Structure, Experimental Schematics, and WT on UV-irradiated λ-DNA.
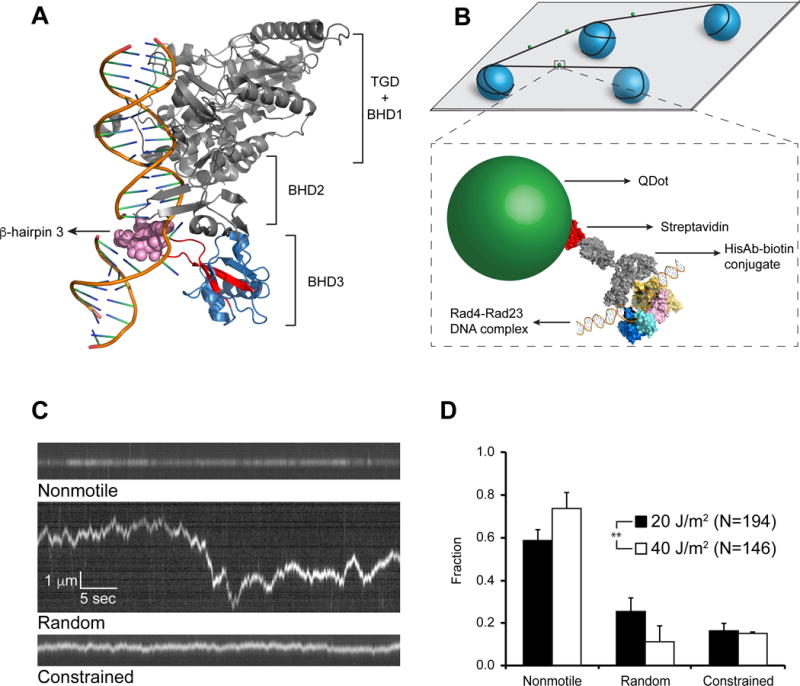
(A) Co-crystal of Rad4-Rad23 with CPD-mismatch-containing DNA (PDB ID: 2QSG). TGD domain and β-hairpin domains 1 and 2 of Rad4, as well as Rad23, are shown in gray, β-hairpin domain 3 in blue, with β-hairpin 3 in red. Residues 599–605 are shown as pink spheres.
(B) Schematics of flow cell and protein conjugation strategy. Top: 5 μm diameter poly-L-lysine coated silica beads (blue) are deposited on polyethylene glycol treated coverslip (gray). DNA (black) is elongated and strung up across beads by flow. Bottom: His-tagged Rad4-Rad23 (yellow, pink, cyan, and blue) is labeled with streptavidin (red)-coated quantum dot (SAQD, green) through a His-antibody (His-Ab)-biotin conjugate (gray). See also Figure S1.
(C) Representative kymographs depicting top: nonmotile (see also Movie S1), middle: random diffusion (see also Movie S2), and bottom: constrained motion (see also Movie S3) particles. Scale bars in middle panel apply to all three kymographs.
(D) Bar graph of fractions of each observed motion type on λ-DNA irradiated with 20 J/m2 (black bars) or 40J/m2 (white bars) UV light (p = 0.0026, χ2 test). All bar graph data in this study are represented as weighted means ± weighted standard deviations over four to five independent experimental days. (Statistical significance *: p ≤ 0.05, **: p ≤ 0.01, ***: p ≤ 0.001, ****: p ≤ 0.0001)