
Figure 2. Behavior of WT Rad4-Rad23 on UV-irradiated λ-DNA at Different Salt Concentrations.
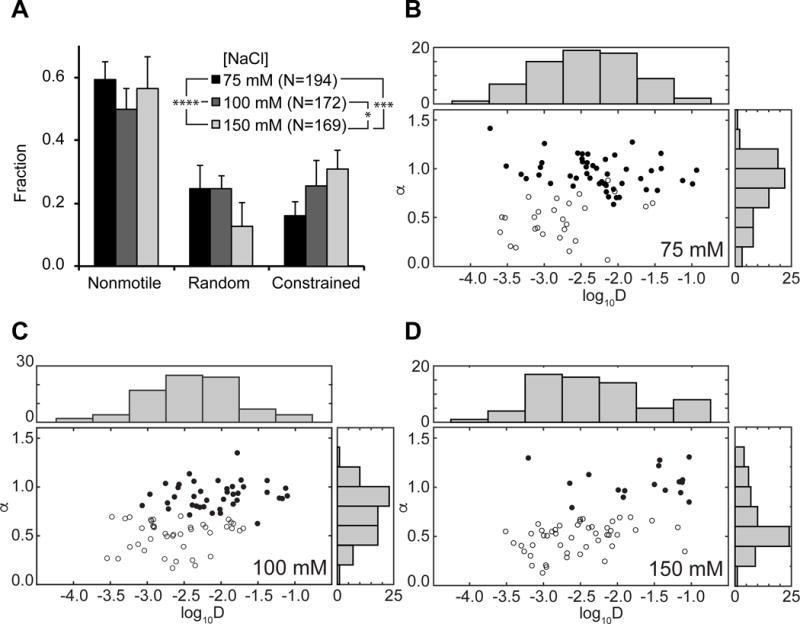
(A) Distributions of observed motion types at different salt concentrations. Data at 75 mM NaCl reproduced from Figure 1D (p = 0.0005, χ2 test).
(B – D) Anomalous diffusion exponent (α) vs. diffusion coefficient (log10D) plotted for random (filled circles) and constrained (empty circles) particles at (B) 75 mM, (C) 100 mM, and (D) 150 mM NaCl. Distributions of diffusion coefficients log10D and anomalous diffusion exponents α are plotted above and to the right of each scatter plot, respectively.