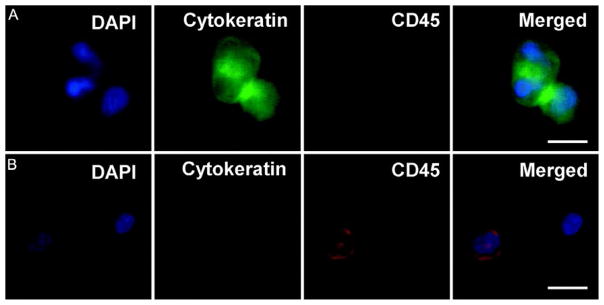
Fig. 3.
Fluorescence microscope images of CTCs captured from patient bloods: (A) a representative image of CTCs, with DAPI+, cytokeratin+, and CD45−; (B) typical image of white blood cells (WBCs), with DAPI+, CK−, and CD45+. Scale bar=10 μm. W. Sheng, et al., Capture, release and culture of circulating tumor cells from pancreatic cancer patients using an enhanced mixing chip. Lab Chip 14(1) (2014) 89–98. Reproduced with a permission of The Royal Society of Chemistry.

