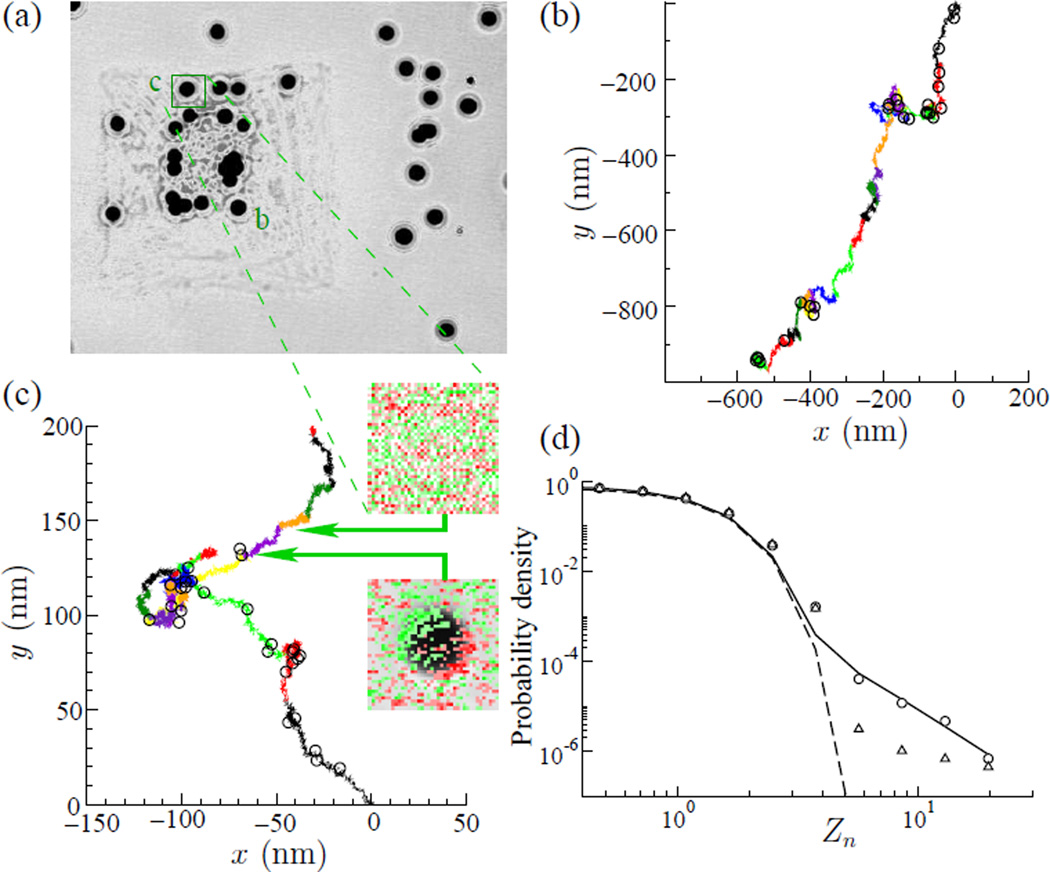
Fig. 1.
(a) Microbeads probes attached in micro-patterned Airway Smooth Muscle Cell were tracked using images at 12 Hz recorded by a CCD camera attached to an inverted microscope. (b,c) Ten minutes of bead trajectory. Each colored line in (b,c) represents 40 seconds of trajectory. (b) bead labeled “b” and (c) bead “c”, circles in the trajectory indicate large values of Zn > 3. The insets in (c) are images originally from (a) which were digitally processed to highlight differences between consecutive images. Red color indicates the reduction of the gray scale level of the image while green indicate an increase. The top inset shows the typical fluctuation of gray scale in a position occupied by a bead, see arrows from (a). The bottom inset shows a “cytoquake”, note the red-green shadow in the superimposed image of the bead indicating a fast motion in the NW direction. The open circles on top of the graph show the 30 biggest jumps in this series, all of them Zn > 3. (d) Histogram of the normalized bead displacements Zn (circles) in a log-log graph. The continuous line shows the best-fit using , with B=0.79, β = 1.80, A=0.05, ZG=0.87 and α=3.62. The dashed line shows a Gaussian fit, and the triangles is ATP depleted. The graph shows two regions: the first region, for small Zn where the histogram of all combined data follows a Gaussian distribution (dashed line), associated with thermal motion; and a second region, the tail of the graph, rare events, follows a power law.

