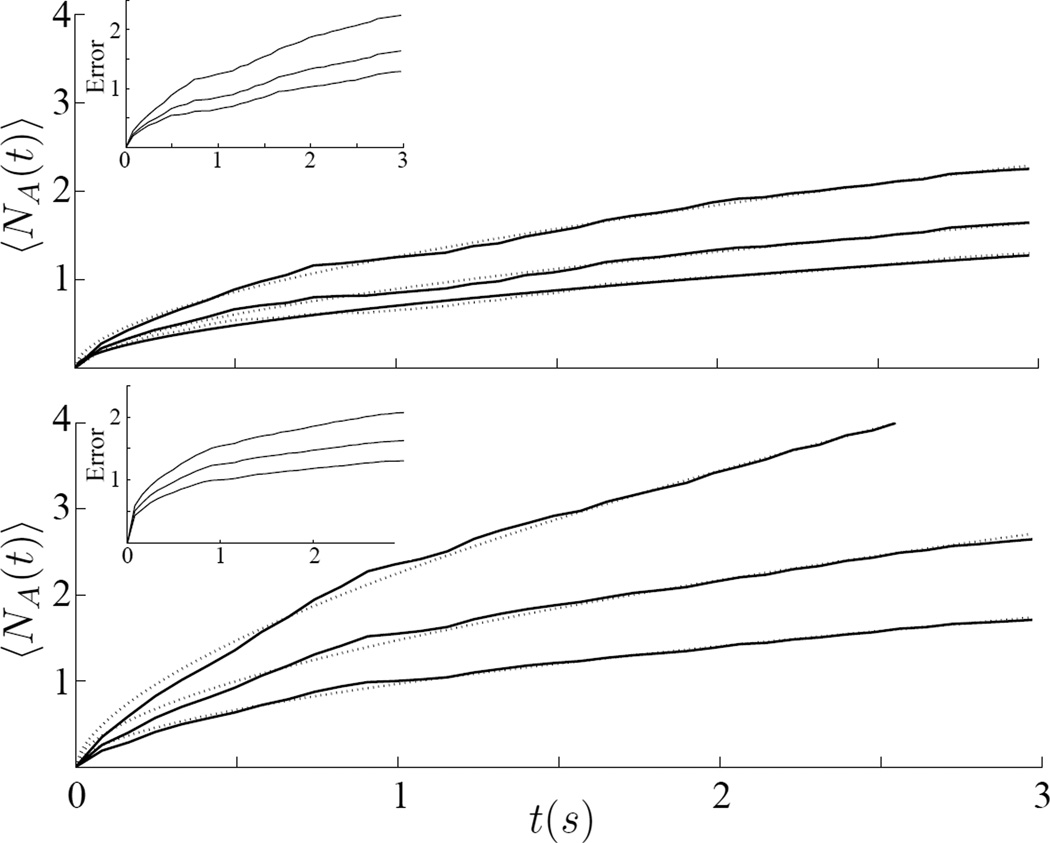
Fig. 2.
The average cumulative number 〈NA(t)〉 of jumps Zn larger than a threshold ZA for a given initial trigger ZM: (top) ZM=5, and from top to bottom the continuous lines were obtained for ZA= 3, 3.5 and 4 respectively. The dashed lines are the best fit of the Eq. 2, and the parameter a found were 0.45, 0.44 and 0.45 respectively; (bottom) ZM = 4, and from top to bottom the continuous lines were obtained for ZA = 2, 2:5 and 3 respectively. The dashed lines are the best fit of the Eq. 2, and the parameter a found were 0.39, 0.44 and 0.46 respectively. The inset show the Poisson error counting of the experimental data.

