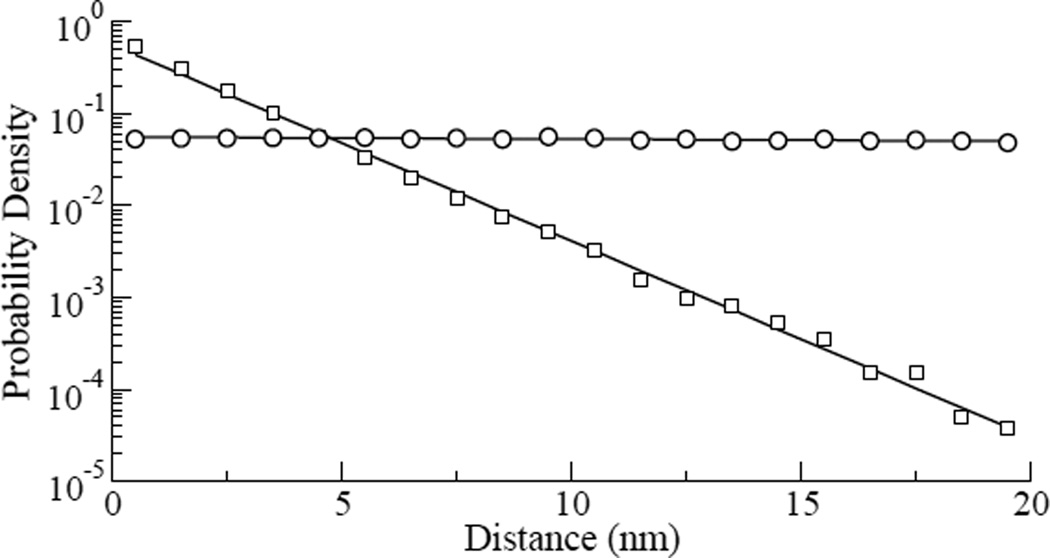
Fig. 4.
Probability densities of the distances between points where Zn ≥ 3 for all combined experimental data of the cells at 24°C (squares), and for all combined data of the simulations of the Gaussian random walk simulation (circles), the continuous line is the exponential fit of the data, with exponents −0.5 and 0.0, respectively. In the simulation we used a Gaussian distribution with zero mean and standard deviation SD=6.07 nm obtained from the experimental data.

