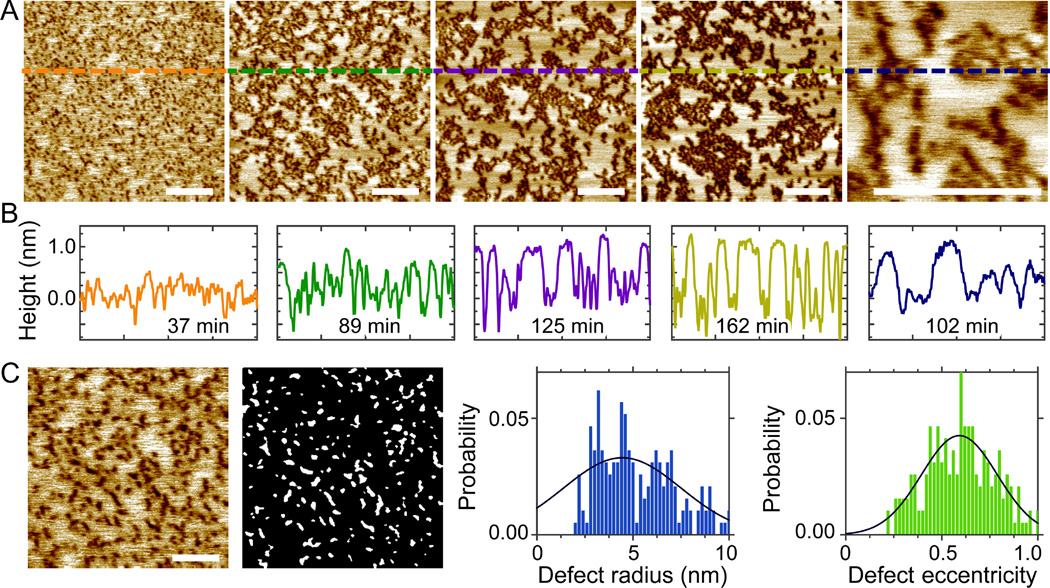
Figure 7.
(A) Solution AFM height images of the DOPC/eSM/Chol 0.41/0.27/0.32 bilayer doped with 2.0mol% melittin. From left to right, the incubation time is 37, 89, 125, 162, and 102 min. Scale bars = 200 nm. (B) Height profiles along dashed lines highlighted in (A). (C) Defects in the ternary bilayer incubated for 51 min. Scale bar = 100 nm. The gray-scale image shows defects determined by image analysis. Solid lines are Gaussian fits.

