
Figure 1.
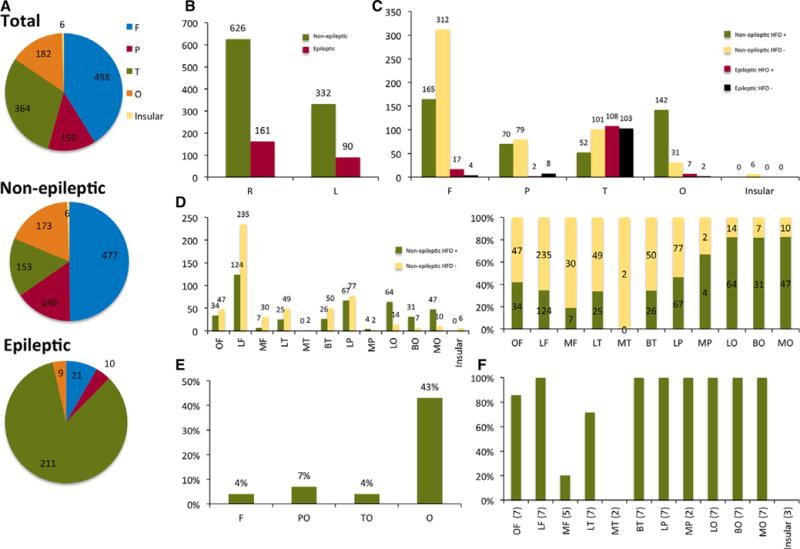
Summary of distribution and classification of contacts in all patients. Numbers represent n of HFO detections unless specified otherwise. (A) Lobar localization of all nonepileptic and epileptic contacts. (B) Contacts distribution and classification per hemispheres. (C) Lobar distribution of contacts and classification according to presence of HFOs and spikes. (D) Sublobar distribution of nonepileptic contacts and classification according to presence of HFOs. The right figure represents normalized ratios of nonepileptic contacts with and without HFOs per sublobes. (E) Percentage of contacts with high-rate nonepileptic HFOs per lobes. (F) Percentage of patients with detected nonepileptic HFOs per region (primarily ripples). Numbers in parentheses denote number of patients with nonepileptic contacts within the region. F, frontal; P, parietal; T, temporal; O, occipital; I, insular; R, right; L, left; OF, orbitofrontal; LF, lateral frontal; MF, mesial frontal; LP, lateral parietal; MP, mesial parietal; BT, basal temporal; LT, lateral temporal; MT, mesial temporal; BO, basal occipital; LO, lateral occipital; MO, mesial occipital; PO, parietooccipital; TO, temporooccipital.
Epilepsia © ILAE