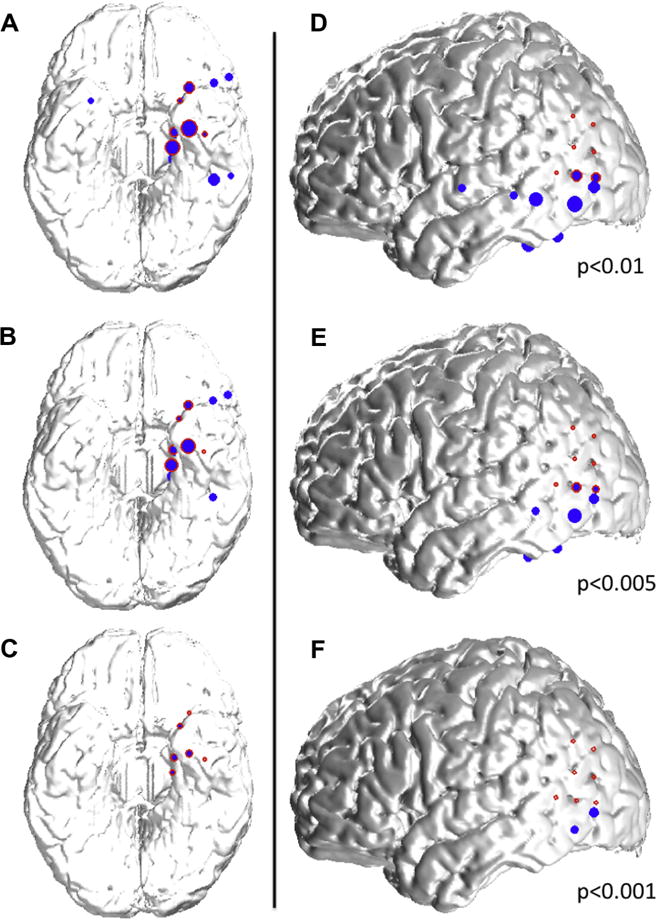
Fig. 3.

Examples of spatial distribution of detected spikes based on their prominence. (A–C) 39 year-old woman with left mesial temporal lobe epilepsy associated with hippocampal sclerosis. Spikes detected with a 0.01 threshold (A; blue dots) are located in the left inferior and mesial temporal lobes, as well as in the right mesial temporal lobe and the left inferior frontal lobe, and overlap partly with the seizure onset zone (red circles) in the mesial temporal lobe. By increasing the detection threshold (decreasing alpha values to 0.005 (B) and 0.001 (C)), more prominent spikes are detected (please refer to Fig. 2C); the spatial distribution of these spikes is more restricted and in this case confined to the seizure onset zone for the most prominent spikes (C). (D–F) 34-year old woman with left neocortical temporo-parietal epilepsy. Spikes detected with a 0.01 threshold (C; blue dots) are located in the left inferior and lateral temporal lobes, as well as in the left inferior parietal lobe, and overlap partly with the seizure onset zone (red circles) in the temporo-parietal junction. By increasing the detection threshold (decreasing alpha values to 0.005 (E) and 0.001 (F)), more prominent spikes are detected (please refer to Fig. 2C); the spatial distribution of these spikes is more restricted and in this case limited to an area at the border of the the seizure onset zone for the most prominent spikes (F). (For interpretation of the references to color in this figure legend, the reader is referred to the web version of this article.)
