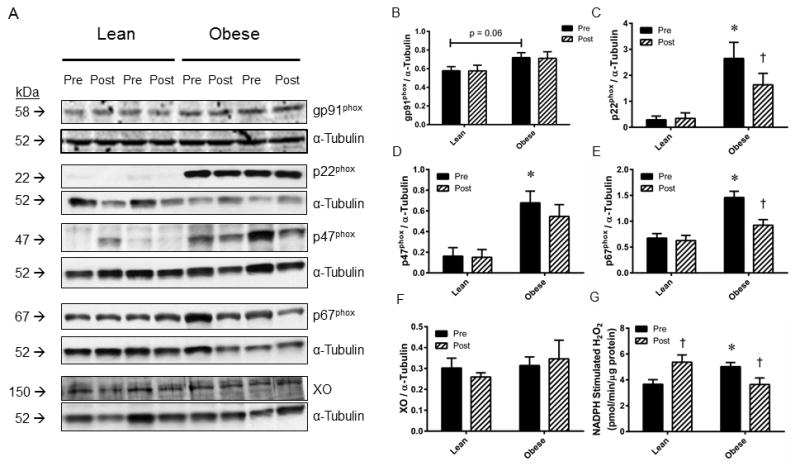
Figure 5. Protein expression of NADPH oxidase subunits, xanthine oxidase, and NADPH oxidase activity in lean and obese skeletal muscle.

(A) Representative Western blot images for NADPH oxidase subunits gp91phox, p22phox, p47phox, p67phox, and xanthine oxidase from skeletal muscle obtained from lean and obese subjects before (Pre) and after (Post) eight weeks of aerobic exercise training. Images of α-tubulin are provided for a loading control. Densitometry analyses for (B) gp91phox, (C) p22phox, (D) p47phox, (E) p67phox, (F) xanthine oxidase expression normalized to α-tubulin. (G) NADPH-stimulated H2O2 generation was measured as an index of NADPH oxidase activity. Values are mean±SEM for n=5 subjects per group. *P<0.05 vs. lean group. †P<0.05 vs. pre-training.
