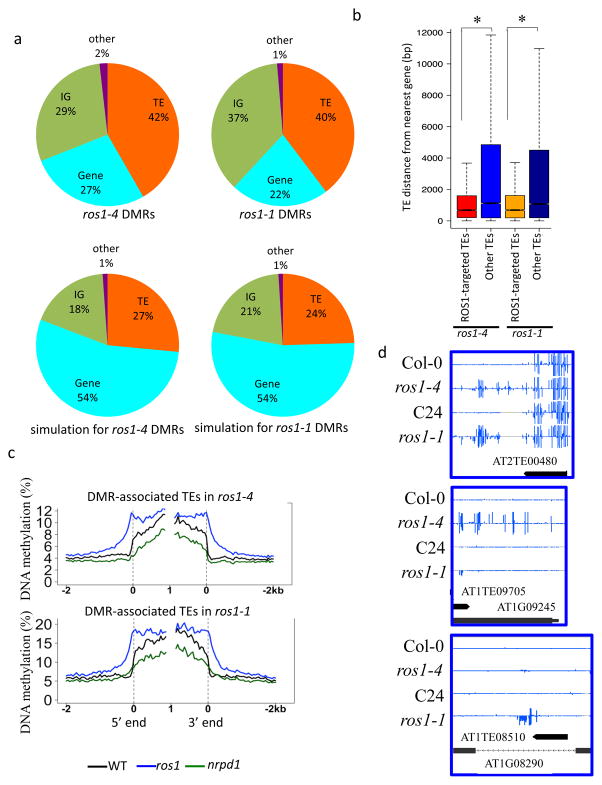
Figure 1. Characterization of the DNA methylomes of ros1 mutants in Col-0 and C24 ecotypes.
a. Composition of the hyper DMRs in ros1-4, ros1-1 and of the corresponding simulated genomic regions.
b. Box plot showing the distances between ROS1-targeted or non-targeted TEs and their nearest protein coding genes (*p-value < 2.2e-16, one-tailed Wilcoxon rank sum test).
c. DNA methylation levels of ros1 hyper DMR-associated TEs in wild type, ros1 and nrpd1 mutants. TEs were aligned at the 5′ end or the 3′ end, and average methylation for all cytosines within each 50 bp interval was plotted.
d. Methylation levels at shared or non-shared hyper DMRs between ros1-1 and ros1-4. Integrated Genome Browser (IGB) display of whole-genome bisulfite sequencing data is shown in the screenshots. DNA methylation levels of cytosines were indicated with the heights of vertical bars on each track.

