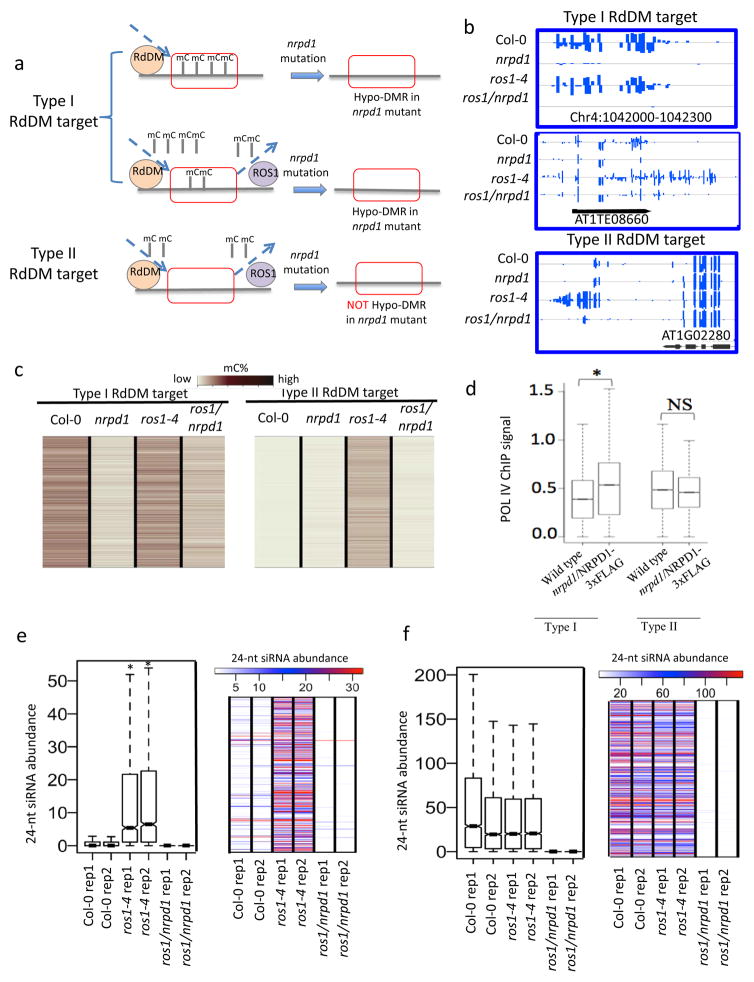
Figure 3. Identification and characterization of type II RdDM targets.
a. Schematic hypothesis that different RdDM targets may be regulated differently by ROS1. Some type I RdDM targets are not regulated by ROS1 (Upper panel) whereas other type I RdDM targets are regulated by ROS1, although RdDM is more dominant at these loci (Middle panel). Type II RdDM targets are always regulated by ROS1, and ROS1 is more dominant at these loci (Lower panel).
b. Methylation levels of type I and type II RdDM targets in Col-0, nrpd1, ros1-4, and ros1/nrpd1. The three panels are representative regions as diagramed in Fig. 3a respectively.
c. Heat maps showing DNA methylation levels of all type I and type II RdDM target loci in different genotypes.
d. Box plot showing Pol IV enrichment at type I and type II RdDM targets. Pol IV signal in wild type plants served as control. (*p-value<2.2e-16, one-tailed Wilcoxon rank sum test; NS, not significant).
e. Box plot and heat map showing 24-nt siRNA abundance of type II RdDM target loci in different genotypes (*p-value<2.2e-16, paired two-sample t-test).
f. Box plot and heat map showing 24-nt siRNA abundance of type I RdDM target loci in different genotypes.

