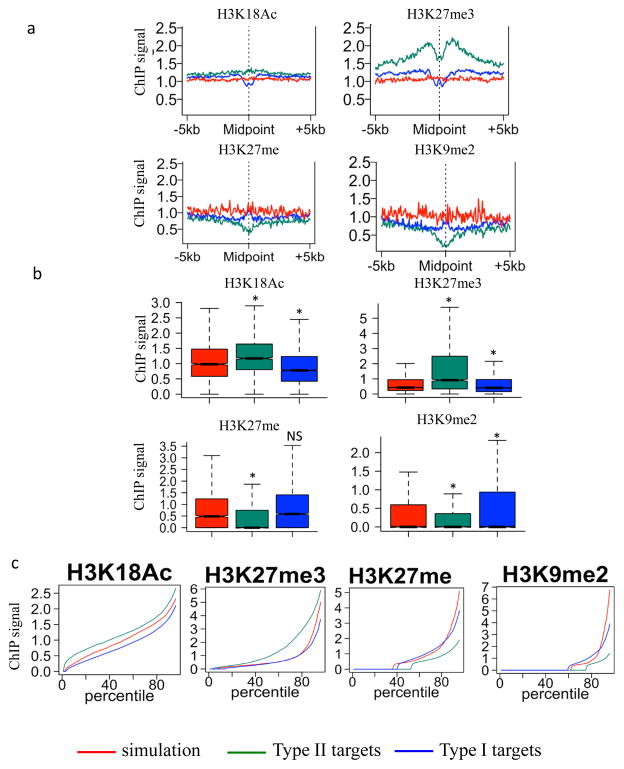
Figure 4. Chromatin features associated with type I and type II RdDM targets.
a. Association of different histone modifications at regions surrounding the mid-points of type I and type II targets. Simulation regions served as control regions.
b. Box plots showing the same results as in Fig. 4a. (*p-value<0.005, one-tailed Wilcoxon rank sum test; NS, not significant compared to simulation).
c. Percentile plots of the same data as in Fig. 4b. For each histone mark, simulated regions, type I and type II RdDM targets were ranked based on their histone ChIP signals from low (left) to high (right) along X-axis.

