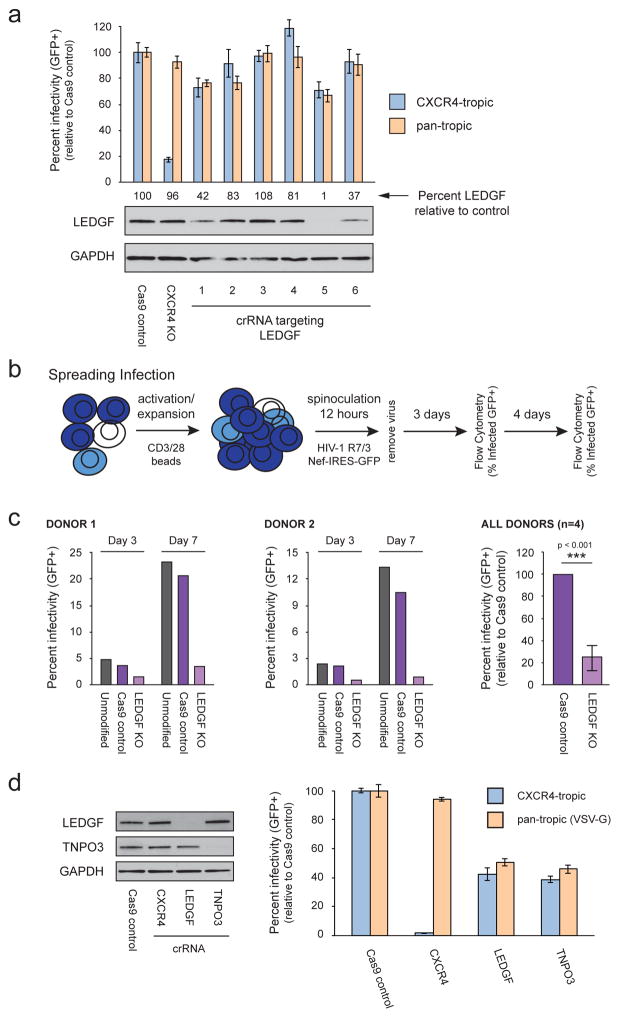
Figure 3.
Knock-out of LEDGF and TNPO3 inhibit early events of HIV infection in primary T cells. (a) Primary T cells were isolated from two different donors and electroporated with the indicated Cas9 RNPs including 6 different RNPs targeting LEDGF. Four days after electroporation, cells were removed for immunoblotting and genomic DNA isolation. At the same time, cells were infected with a CXCR4-tropic (LAI strain) GFP reporter virus or an identical VSV-G pseudotyped, Env-deficient virus in technical triplicate. After 36 hours, percent infected cells (GFP+) were determined by flow cytometry. The bar graph depicts the average percent infected cells across technical triplicates +/− standard deviation for one representative donor. LEDGF protein levels were quantified and depicted immediately above the immunoblot. (b) Procedural schematic depicting the modified stimulation/infection protocol for analyzing the LEDGF knock-out cells over the course of a spreading infection. (c) Primary T cells were isolated from four different donors and electroporated with buffer alone, Cas9 alone, or the most effective Cas9 RNP targeting LEDGF (crRNA #5, see above). Cells were infected as indicated in (b) and percent infection determined by flow cytometry. Results for two donors are depicted at days 3 and 7 in the first two graphs. The final graph depicts the average percent infection observed in the Cas9 control and LEDGF KO cells across all four donors at day 3 +/− standard deviation. (d) Primary T cells were isolated from two different donors and electroporated with the indicated Cas9 RNPs. Four days after electroporation, cells were removed for immunoblotting. At the same time, cells were infected with a CXCR4-tropic (LAI strain) GFP reporter virus or an identical VSV-G pseudotyped, Env-deficient virus in technical triplicate. After 36 hours, percent infected cells (GFP+) were determined by flow cytometry. The bar graph depicts the average percent infected cells across technical triplicates +/− standard deviation for one representative donor. See also Figure S3 and Table S1.

