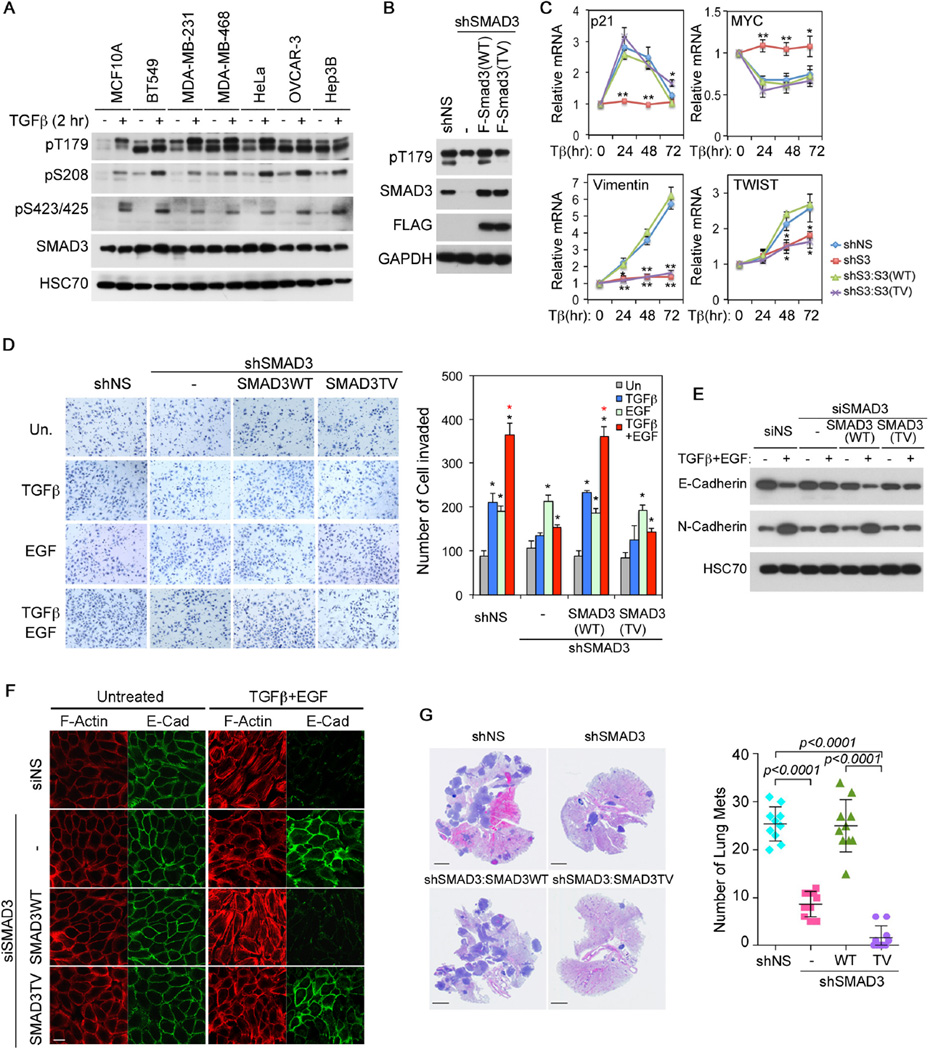
Figure 1. SMAD3 T179 phosphorylation is required for TGF-β-mediated invasion.
A: Phosphorylation of SMAD3 in normal mammary gland epithelial cell MCF-10A and various cancer cells. The SMAD3 pT179 antibodies recognize both SMAD2 pT220 (upper band) and SMAD3 pT179 (lower band).
B: Generation of stable SMAD3 knockdown HeLa cells and cells in which SMAD3 expression was rescued with shSMAD3-resistant, F-SMAD3(WT) or F-SMAD3(TV) construct.
C: qRT-PCR analyses of p21, MYC, Vimentin and TWIST mRNAs in HeLa cells. Relative levels of expression were normalized to untreated cells. Data are shown as mean ± S.D. (n=3), and statistical significance over shNS cells are indicated. *, p<0.02; **, p<0.002.
D: Invasion assays in HeLa cells carrying various SMAD3 vectors. Quantitation data are shown as mean ± S.D. (n=3). Statistical significance (p<0.02) is indicated for treated versus untreated samples (black *) and for samples treated with TGF-β and EGF versus those with TGF-β alone (red *).
E: E-Cadherin and N-Cadherin expression in MCF10A cells carrying various SMAD3 vectors after TGF-β and EGF treatment for 3 days.
F: Immunofluorescence staining of F-Actin (phalloidin) and E-Cadherin in MCF10A cells after TGF-β and EGF treatment for 4 days. Bar = 20 µm.
G: H&E staining of lung sections from nude mice that were tail-vein injected with various HeLa cells. Bars = 5 mm. Numbers of lung metastasis nodule per animal are shown in the right as mean ± SD (n=10).
See also Figure S1.

