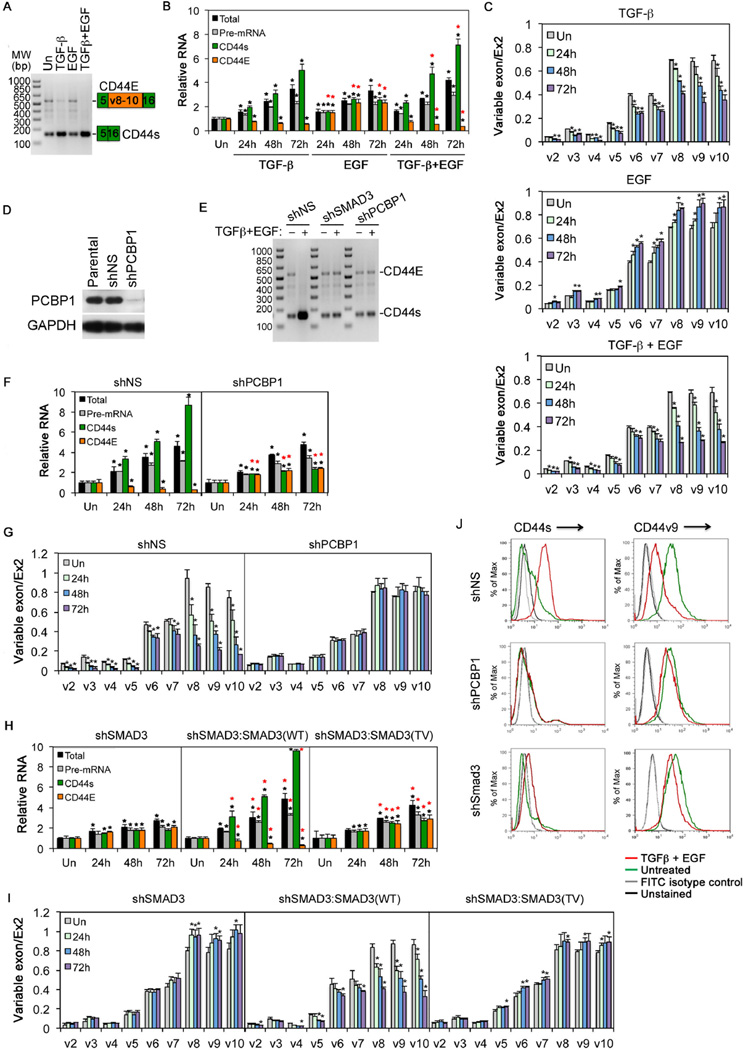
Figure 3. PCBP1 and SMAD3-dependent CD44 isoform switch upon TGF-β and/or EGF treatment.
A: Detection of CD44E and CD44s in HeLa cells in a single RT-PCR reaction using one pair of primers. The growth factor treatment was for 24 hr.
B: qRT-PCR analyses of CD44 total mRNA, pre-mRNA, CD44s, or CD44E mRNAs in HeLa cells using specific primer pairs.
C: qRT-PCR analyses of CD44 variable exon usage in HeLa cells.
D: Western blot showing PCBP1 knockdown in HeLa cells.
E: RT-PCR detection of CD44s and CD44E as in A. HeLa cells were treated with TGF-β and EGF for 72 hr.
F: qRT-PCR analyses of different CD44 RNAs in HeLa cells treated with TGF-β and EGF.
G: qRT-PCR analyses of CD44 variable exon usage in HeLa cells treated with TGF-β and EGF.
H: qRT-PCR analyses of different CD44 RNAs in HeLa cells treated with TGF-β and EGF
I: qRT-PCR analyses of CD44 variable exon usage in HeLa cells treated with TGF-β and EGF.
J: FACS analyses of cell surface expression of CD44 isoforms in HeLa cells. The cells were treated with TGF-β and EGF for 72 hrs.
For qRT-PCR, relative levels of expression were normalized to untreated cells (Un); variable exon usage defined as the ratio between variable exon to standard exon 2. All bars are shown as mean ± SD (n=3). The black * denotes statistical significance (p<0.02) between treated and untreated samples; the red * denotes statistical significance (p<0.02) for samples treated with TGF-β and EGF or EGF versus those with TGF-β alone (B), or for samples expressing shPCBP1 versus those expressing shNS (F), or for samples expressing SMAD3 WT or TV versus those with expressing shSMAD3 (H).
See also Figure S3.

