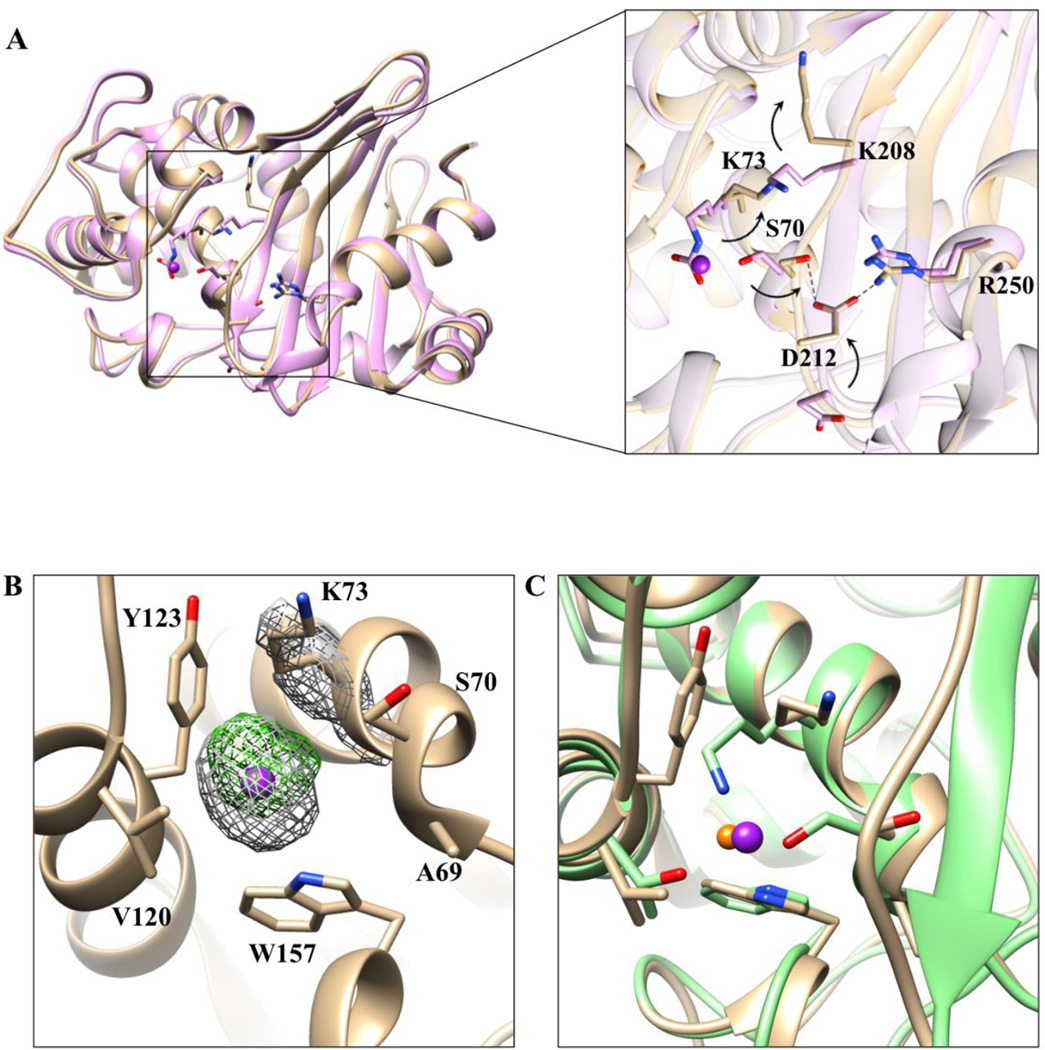
Figure 3. Alignment of the two OXA-163 structures and comparison of chloride and iodide ions in the active site of class D enzymes.
A) 1.72-Å structure (lavender) and 2.87-Å structure with iodide (tan). Iodide is represented as a dark purple sphere with arbitrary radius. The inset provides a more detailed view of the residues (stick model) that undergo large conformational changes due to the presence of the iodide in the active site. In the iodide structure, Asp212 exhibits an altered conformation that results in formation of an electrostatic interaction between with Arg250 (black dashed line). Additionally, the Asp212 residue is within hydrogen bonding distance to the catalytic serine Ser70. The arrows represent the direction of the rearrangements that occur in the iodide structure. B) Iodide and its surrounding environment in the active site. In gray mesh, superimposed, is the 2Fo-Fc simulated annealing difference map calculated with phases from the final refined model and contoured at 3.0 σ level. In green mesh is the anomalous difference map contoured at 5σ. Residues surrounding iodide are labeled and shown in stick model. C) Overlay of OXA-10 (green) inhibited by chloride (orange sphere) and OXA-163 (tan) inhibited by iodide (purple sphere). Iodide is larger than chloride and results in structural rearrangements of the surrounding residues.

