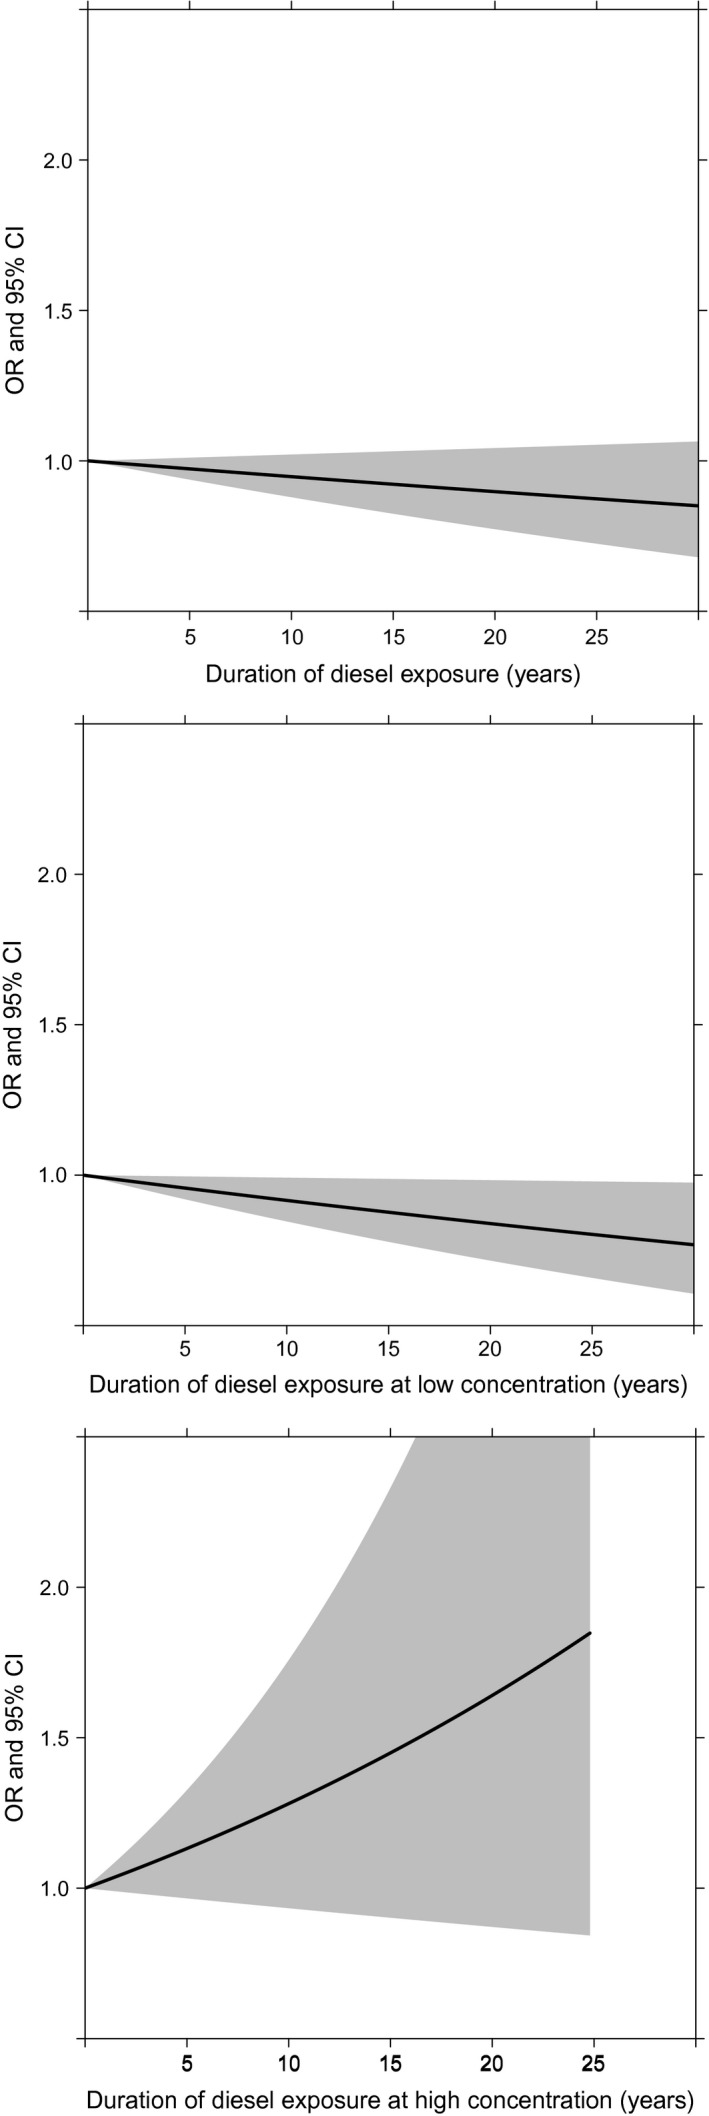
Figure 1.

Duration‐response plots for diesel exposure at any (odds ratios [OR] = 1.00, 0.99–1.00), low (OR = 0.99, 0.98–1.00) and high concentration (OR = 1.03, 0.99–1.06). Duration was modeled in years. OR were adjusted for proxy respondent, province of residence, age at interview, cigarette pack‐years, cumulative asbestos, and cumulative silica exposure.
