
Figure 2.
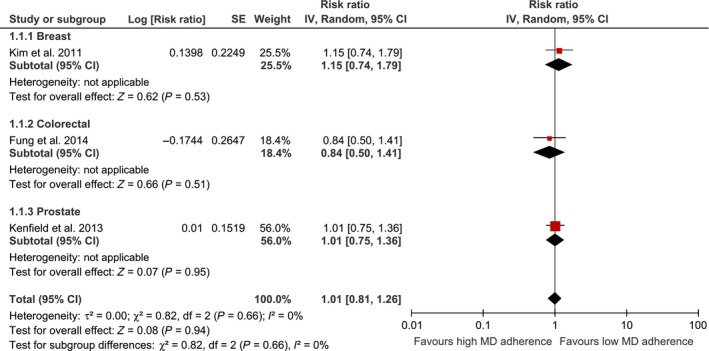
Forest plot showing pooled risk ratios (RRs) with 95% CI for risk of cancer mortality among cancer survivors for three cohort studies. I2, Inconsistency; MD, Mediterranean Diet; SE, standard error; tau, estimate between study variance.
Official websites use .gov
A
.gov website belongs to an official
government organization in the United States.
Secure .gov websites use HTTPS
A lock (
) or https:// means you've safely
connected to the .gov website. Share sensitive
information only on official, secure websites.
Forest plot showing pooled risk ratios (RRs) with 95% CI for risk of cancer mortality among cancer survivors for three cohort studies. I2, Inconsistency; MD, Mediterranean Diet; SE, standard error; tau, estimate between study variance.