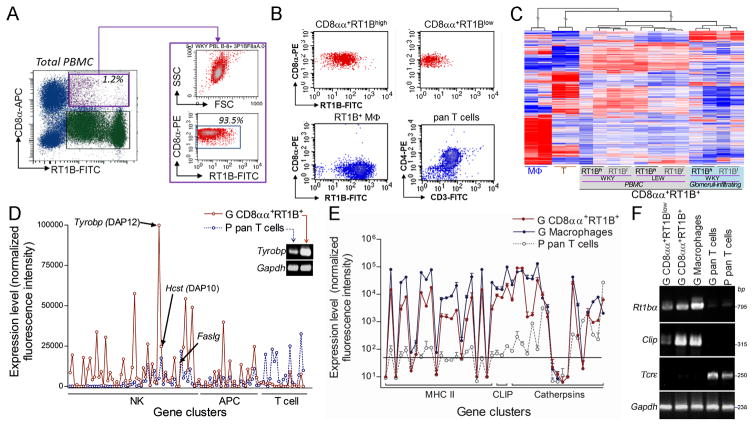
FIGURE 1.
CD8αα+RT1B/D+ cells express both genes associated with professional antigen processing/presenting and NK cytotoxicity. (A) Multi-color flow cytometry analyses show a CD8αα+RT1B/D+ population (purple gate on RT1B-FITC vs CD8α-APC plot, left panel) in rat peripheral blood mononuclear cells (PBMC); right panel shows purified CD8αα+RT1B/D+ population as shown by both SSC vs FSC and CD8α vs RT1B/D plot. (B) Representative flow cytometric plots show each isolated population from glomeruli infiltrating leukocytes as indicated on the top of each plot. MΦ, macrophages. (C) A representative clustering analysis based on DNA microarray shows similar global gene expression patterns among all CD8αα+RT1B/D+ subpopulations from different sources in both LEW and WKY rats; glomeruli-infiltrating macrophages (MΦ) and pan T cells are shown as controls. (D) Summary of expressions of gene clusters associated with NK cells, APCs and T cells. n=4. Inset, RT-PCR detection of Tyrobp and control house keeper gene Gapdh. (E) Summary of expressions of genes associated with Ag processing/presentation for professional APCs; expression levels in (D) and (E) are mean normalized intensities for each gene in DNA microarray. n=4. (F) A representative RT-PCR shows expression of Ag presenting related α chain of rat MHC class II RT1B (Rt1bα) and invariant chain (Clip) in various cell populations as indicated; TcR ε chain (Tcrε) and Gapdh were used as controls.

