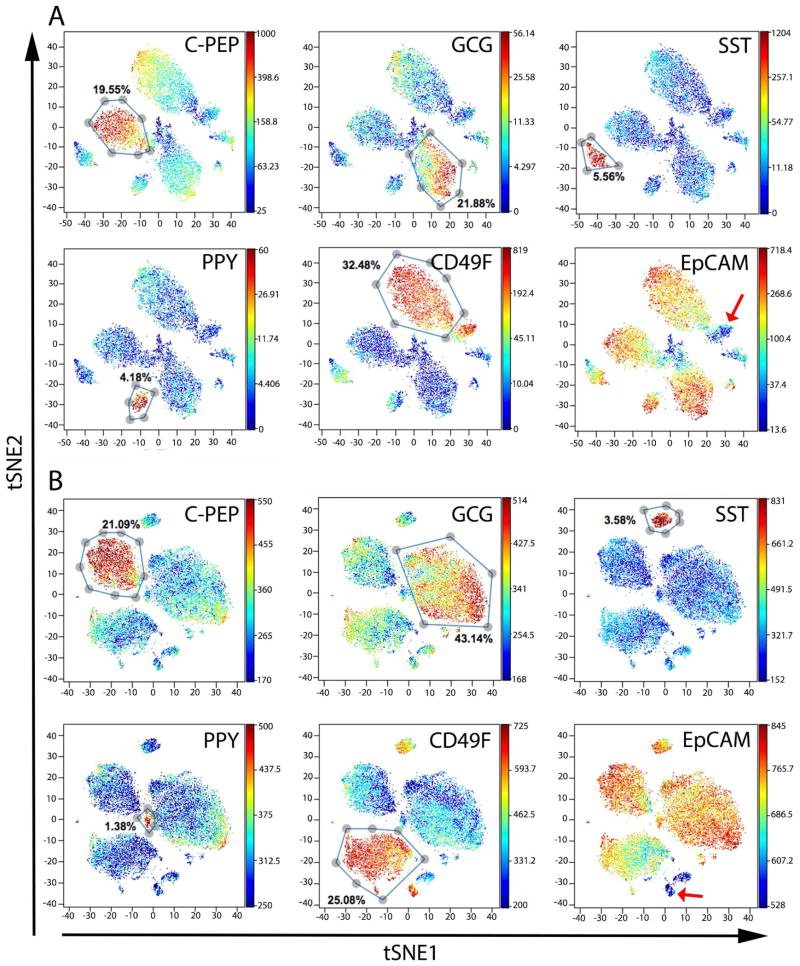
Figure 2. viSNE maps show distinct clusters representing different cell types.
t-SNE analysis was performed with all antibody markers used in our experiments. Each dot in the viSNE map represents an individual cell. In all panels, the same viSNE map is shown, colored sequentially by the labeling intensity of C-PEPTIDE (C-PEP, beta cells), GLUCAGON (GCG, alpha cells), SOMATOSTATIN (SST, delta cells), POLYPEPTIDE (PPY, PP cells), CD49F, and EpCAM antibodies. Representative data from two normal adult donors are shown. (A) ACD1098 and (B) ACGZ275. See also Figure S2B for viSNE maps colored by each of the 24 antibodies; Figure S3 for barcoding experiments demonstrating sample-to-sample variation and Figure S4 for biaxial plots of EpCAM and CD49F from all donors. See Table S3 for donor information.

