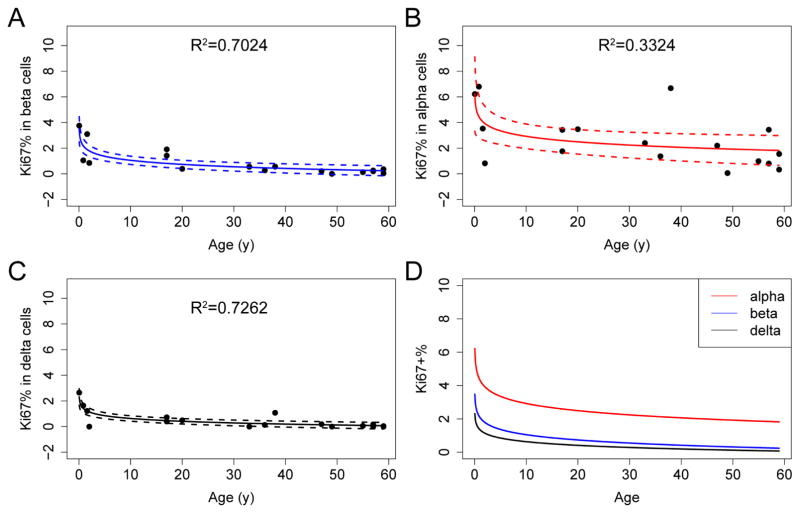
Figure 4. Mass cytometry permits the precise and simultaneous assessment of the proliferation index for different endocrine cell types.
(A–C) The percentage of Ki67-positive endocrine cells declines with age in all major endocrine lineages. Each dot represents an individual donor. Regression lines and confidence intervals are also shown. Regression is performed with the linear regression command in R, with the model of (Percentage of Ki67+ cells) ~ log (Age). R2 is shown in each panel. (D) Overlay of regression curves of Ki67 indexes for alpha (red), beta (blue), and delta (black) cells. See Figure S5 for correlation between Ki67 and IdU signals in CyTOF. See Table S5 for quantification of Ki67+ cells in each cell type for each donor.

