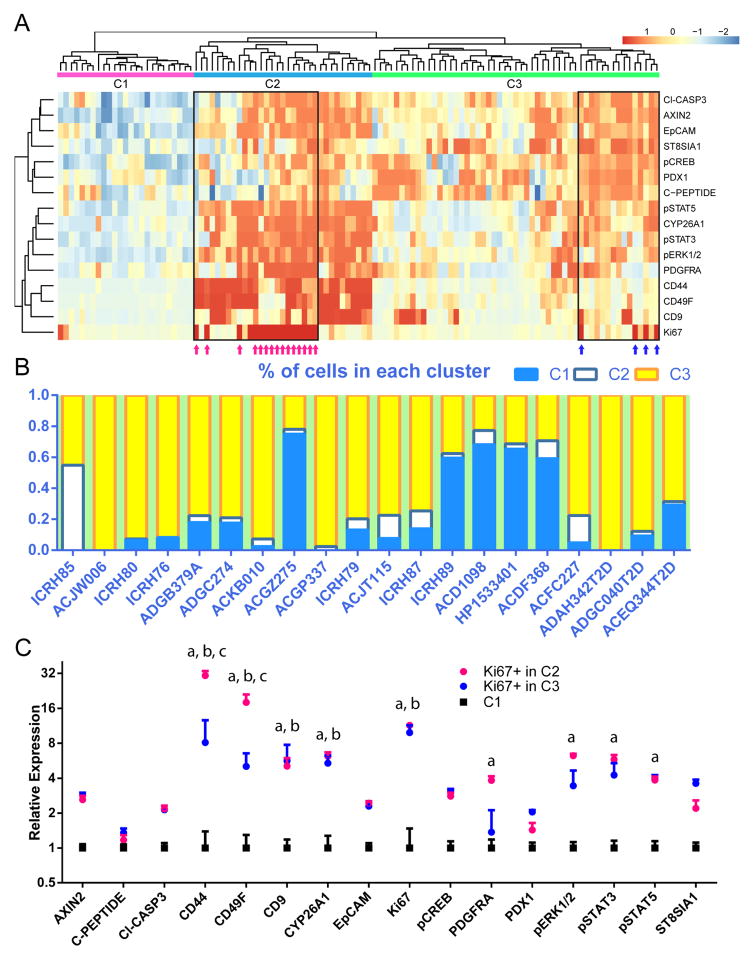
Figure 7. Three main clusters of beta-cells are observed from multiple donors, and cells with relatively high levels of Ki67 separate into two of the clusters.
(A) Hierarchical clustering of groups of beta cells from all donors reveal three major clusters, labelled C1, C2 and C3. Ki67+ cells separate into two groups, co-segregating either with C2 or C3 clusters (magenta and blue arrows within black box). Each column of the heatmap represents one subgroup from viSNE map (an example of which is shown in Figure 6(A)), with the addition of populations of Ki67+ beta cells gated directly from individual donor. Each row of the heatmap represents the relative expression level of one protein. 16 antibody channels are utilized in samples from all donors. (B) Census of the percentage of cells in each cluster from individual donors, ordered by age. T2D samples are shown on the right. (C) Expression levels of the 16 proteins from cells in C1, Ki67+ cells in C2, and Ki67+ cells in C3. Each data point represents mean expression + standard error of one of the three populations, normalized to C1. a, b, and c indicate significance as calculated by a two-way ANOVA test with Tukey’s correction. a: comparison between C1 and Ki67+ in C2. b: comparison between C2 and Ki67+ in C3. c: comparison between Ki67+ in C2 and Ki67+ in C3. See also Figure S7 for each cluster mapped back onto a viSNE plot.

