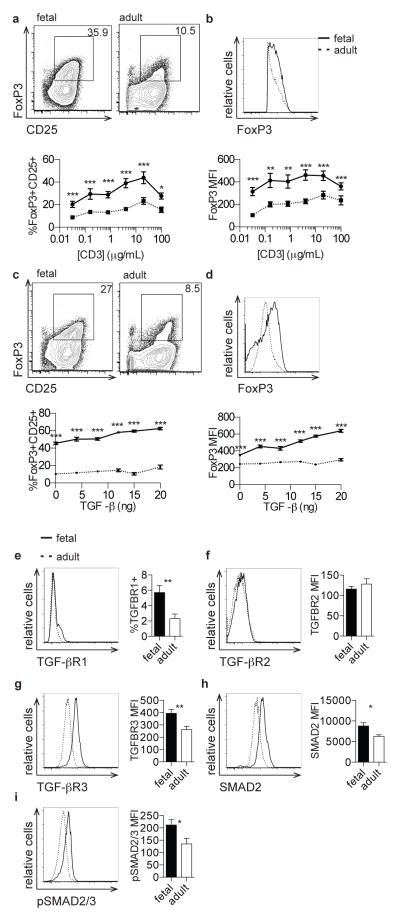
Figure 2. Naive fetal T cells have an increased propensity to differentiate into Tregs and exhibit enhanced signaling through the TGF-β pathway.
a. Flow cytometry analysis of staining for intracellular FoxP3 and surface CD25 on fetal and adult CD4+ T cells stimulated with 0.8 μg/mL α-CD3. Graph shows percentage of FoxP3+CD25+ cells within the CD4+ population following stimulation across a range of α-CD3 concentrations. b. Flow cytometry analysis of staining for intracellular FoxP3 on fetal and adult FoxP3+CD4+ T cells following stimulation as above. Graph shows FoxP3 MFI within the FoxP3+CD4+ population following stimulation. c. Flow cytometry analysis of staining for intracellular FoxP3 and surface CD25 on fetal and adult CD4+ T cells stimulated with 0.8 μg/mL anti-CD3 in the presence of 8 ng TGF-β. Graph shows percentage of FoxP3+CD25+ cells within the CD4+ population following stimulation across a range of TGF-β concentrations. d. Flow cytometry analysis of staining for intracellular FoxP3 on fetal and adult FoxP3+CD4+ T cells stimulated with 0.8 μg/mL anti-CD3 in the presence of TGF-β. Graph shows FoxP3 MFI within the FoxP3+CD4+ population following stimulation, as above. e–h. Flow cytometry analysis of staining for TGF-βRI, TGF-βRII, TGF-βRIII, and SMAD2 on fetal and adult naïve CD4+ T cells. Bar graphs show percentage of TGF-βRI+ cells and MFI of TGF-βRII, TGF-βRIII, and SMAD2 within the naïve CD4+ population. i. Flow cytometry analysis of staining for intracellular phosphorylated SMAD2/SMAD3 on fetal and adult naïve CD4+ T cells in the presence of 2 ng TGF-β. Bar graph shows phosphorylated SMAD2/SMAD3 MFI within the naïve CD4+ population. Panels a–d are pre-gated on cell size, live, CD3+CD8−CD4+ (see Supp. Fig. 1). Panels e–i are pre-gated on cell size, live, CD3+CD8−CD4+CD45RA+ (see Supp. Fig. 2). The data are representative of results from 8 fetal and 8 adult individuals in 3 independent experiments. Statistics refer to Mann-Whitney test. *** p<.001, ** p<.01, * p<.05

