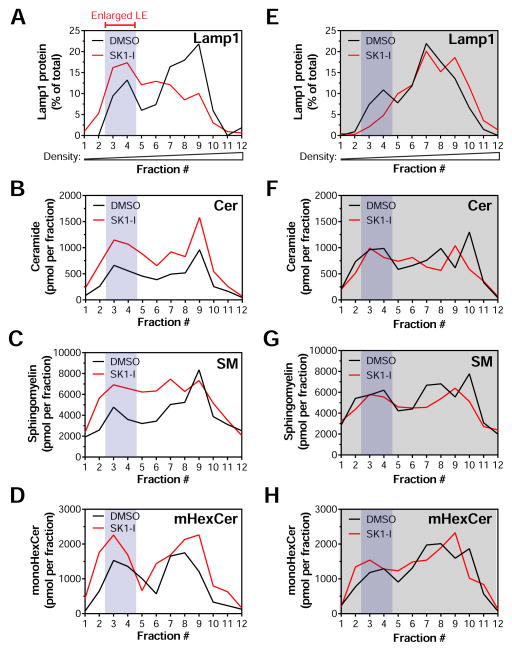
Figure 4. SK1-I accumulates sphingolipids in enlarged late endosomes.
WT (A–D) or SphK1−/− (E–H) MEFs were treated with DMSO or 10 μM SK1-I for 4 h followed by subcellular fractionation. Protein expression was quantified by immunoblot and presented as percent enrichment in each fraction. Sphingolipids were quantified by LC-MS/MS and presented as pmol lipid per fraction. (A and E), Lamp1. (B and F), Ceramide. (C and G), Sphingomyelin. (D and H), Monohexosylceramide. See also Figure S5.

