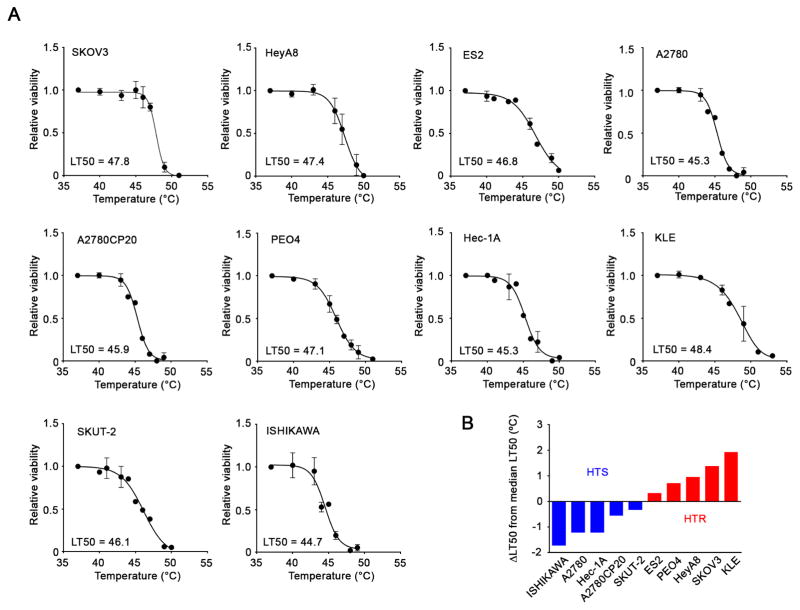
Figure 1. Variability in hyperthermia sensitivity of ovarian and uterine cancer cell lines.
(A) Ovarian and uterine cancer cells were treated with hyperthermia for 1 hr at the indicated temperatures and then incubated at 37°C. Cell viability was determined using an MTT assay at 24 hr. The value in each graph represents the LT50 that produced 50% cell death. (B) Difference in each LT50 from the median LT50 (46.5°C) in the tested cells. The cells having LT50s above or below and below the median LT50 were classified as HTR and HTS, respectively.
See also Figures S1 and S2

