. 2016 Oct 10;5:e18383. doi: 10.7554/eLife.18383

Figure 3. Optogenetically inactivating Sst+ interneurons, compared to inactivating Pvalb+ interneurons, produces different linear transformations of FTCs.

(a) FTCs (mean ± SEMs) of representative units demonstrating all the combinations of linear transformations observed with inactivation of either Sst+ cells (pink) or Pvalb+ cells (light blue). (b) Fraction of units that showed each kind of linear transformation with inactivation of Sst+ cells (pink) and inactivation of Pvalb+ cells (light blue). These proportions are significantly different between groups (Arch/Sst: n = 44 units from 12 mice; Arch/Pvalb: n = 41 units from 11 mice; Fisher’s exact test p=1.5 × 10−3). (c) Population best-fit slope coefficients with inactivation of Sst+ cells (pink) and inactivation of Pvalb+ cells (light blue). Slopes were significantly different between groups (rank-sum p=0.01). Dark/light squares indicate units for which the slope was/was not significantly different from 1, respectively. Lines indicate population medians and lower/upper quartiles. (d) Population best-fit y-intercepts, normalized by maximum firing rate, with inactivation of Sst+ cells (pink) and inactivation of Pvalb+ cells (light blue). Y-intercepts were significantly different between groups (rank-sum p=1.5 × 10−4). Dark/light squares indicate units for which the y-intercept was/was not significantly different from 0, respectively. Lines indicate population medians and lower/upper quartiles.

DOI: http://dx.doi.org/10.7554/eLife.18383.007

Figure 3.

Figure 3—figure supplement 1. Effects of inactivating Sst+ or Pvalb+ cells are mainly linear.

Figure 3—figure supplement 1.

(a) Distribution of the R2 values from the linear regression analysis from units with activation of Sst+ cells (pink) and activation of Pvalb+ cells (light blue). High median R2 values demonstrate that in most units the effects of decreased inhibition are fit well by a linear framework (ChR2/Sst: median R2 = 0.81; ChR2/Pvalb: median R2 = 0.80).
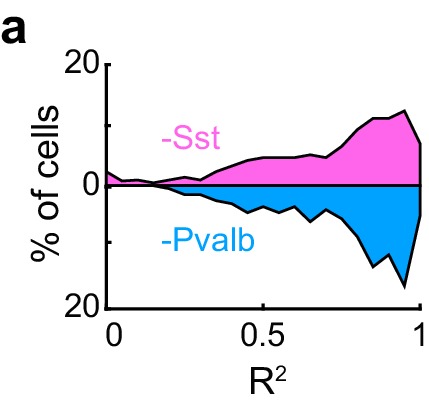
Figure 3—figure supplement 2. Differences between inactivating Sst+ or Pvalb+ cells are present among broad-spiking, but not narrow-spiking, units.

Figure 3—figure supplement 2.

(a) Best-fit slope coefficients for each unit as a function of action potential (AP) duration (trough-to-peak duration). Among the units with narrow-spiking waveforms (≤450 μs) whose activity was increased by light (Arch/Sst: n = 15; Arch/Pvalb: n = 15), Sst+ cell inactivation (pink) and Pvalb+ cell inactivation (light blue) produced slopes that were not significantly different (ranksum p=0.12). However, among the units with broad-spiking waveforms (>450 μs) whose activity was increased by light (Arch/Sst: n = 29; Arch/Pvalb: n = 26), Sst+ cell inactivation produced significantly larger slopes (rank-sum p=0.046) than Pvalb+ cell inactivation. Darker squares represent units for which the slope was significant. (b) Normalized best-fit y-intercepts for each unit as a function of change in sound-evoked firing rate. Among the units with narrow-spiking waveforms (≤450 μs) whose activity was increased by light (Arch/Sst: n =15; Arch/Pvalb: n = 15), Sst+ cell inactivation (pink) and Pvalb+ cell inactivation (light blue) produced y-intercepts that were not significantly different (rank-sum p=0.23). However, among the units with broad-spiking waveforms (>450 μs) whose activity was increased by light (Arch/Sst: n = 29; Arch/Pvalb: n = 26), Pvalb+ cell inactivation produced larger y-intercepts (rank-sum p=0.00012) than Sst+ cell inactivation. Darker squares represent units for which the normalized y-intercept was significant.
Figure 3—figure supplement 3. Effects of inactivating Sst+ or Pvalb+ cells are not explained entirely by increases in spontaneous activity.

Figure 3—figure supplement 3.

(a) An example unit’s FTC (mean ± SEMs) with (light blue) and without (black) inactivation of Pvalb+ cells. Inset shows the linear regression for light-off versus light-on firing rates (FRs) (measured FRs: black dots; fit: light blue line; confidence intervals: light blue shading; unity line: dashed gray line). (b) Baseline-subtracted FTCs from the same unit in (a). Note that the additive component (y-intercept) is still significant after baseline-subtraction, albeit smaller. (c) Best-fit slope coefficients from baseline-subtracted units with inactivation of Sst+ cells (pink) and inactivation of Pvalb+ cells (light blue) were significantly different from each other (rank-sum p=0.0032). Dark/light squares indicate units for which the slope was/was not significantly different from 0, respectively. Lines indicate population medians and lower/upper quartiles. (d) Normalized best-fit y-intercepts from baseline-subtracted units with inactivation of Sst+ cells (pink) and inactivation of Pvalb+ cells (light blue) were significantly different from each other (rank-sum, p=0.00052). Dark/light squares indicate units for which the y-intercept was/was not significantly different from 0, respectively. Lines indicate population medians and lower/upper quartiles.
Figure 3—figure supplement 4. Differences between inactivating Sst+ or Pvalb+ cells are present even in unit populations whose firing rates are weakly affected by interneuron inactivation, as well as in strongly affected unit populations.

Figure 3—figure supplement 4.

(a) Best-fit slope coefficients for each unit as a function of change in sound-evoked firing rate between the light-on and light-off conditions. Among the half of the units that were more weakly affected by interneuron inactivation (Arch/Sst: n = 25, pink; Arch/Pvalb: n = 18, light blue), Pvalb+ cell inactivation produced smaller slopes than Sst+ cell inactivation (rank-sum p=0.0087). Among the half of the units that were more strongly affected by interneuron inactivation (Arch/Sst: n = 19; Arch/Pvalb: n = 23), Pvalb+ cell inactivation produced smaller slopes than Sst+ cell inactivation (rank-sum p=0.025). Darker squares represent units for which the slope was significant. (b) Normalized best-fit y-intercepts for each unit as a function of change in sound-evoked firing rate. Among the half of the units that were more weakly affected by interneuron inactivation (Arch/Sst: n = 25, pink; Arch/Pvalb: n = 18, light blue), Pvalb+ cell inactivation produced larger y-intercepts than Sst+ cell inactivation (rank-sum p=0. 029). Among the half of the units that were more strongly affected by interneuron inactivation (Arch/Sst: n = 19; Arch/Pvalb: n = 23), Pvalb+ cell inactivation produced larger y-intercepts than Sst+ cell inactivation (rank-sum p=0.005). Darker squares represent units for which the y-intercept was significant.
Figure 3—figure supplement 5. Inactivation of Sst+ cells, compared to inactivation of Pvalb+ cells, produces different proportions of linear effects, even after matching unit populations based on firing rate ratios.

Figure 3—figure supplement 5.

(a) The linear regression analysis is limited to units from Arch/Sst mice and Arch/Pvalb mice that have similar sound-evoked firing rate ratios (Arch/Sst: n = 37 units from 12 mice; Arch/Pvalb: n = 37 units from 11 mice). (b) Distribution of the R2 values from the linear regression analysis from ratio-matched units with inactivation of Sst+ cells (pink) and inactivation of Pvalb+ cells (light blue). High median R2 values demonstrate that most ratio-matched units are fit well by a linear framework (Arch/Sst: median R2 = 0.78; Arch/Pvalb: median R2 = 0.87) (c) Fraction of units that showed each kind of linear transformation with inactivation of Sst+ cells (pink) or inactivation of Pvalb+ cells (light blue) were significantly different from each other (Arch/Sst: n = 37 units; Arch/Pvalb: n = 37 units; Fisher’s exact test p=0.0058). (d) Best-fit slope coefficients from ratio-matched units with inactivation of Sst+ cells (pink) and inactivation of Pvalb+ cells (light blue) were significantly different from each other (rank-sum p=0.0064). Dark/light squares indicate units for which the slope was/was not significantly different from 0, respectively. Lines indicate population medians and lower/upper quartiles. (e) Normalized best-fit y-intercepts from ratio-matched units with inactivation of Sst+ cells (pink) and inactivation of Pvalb+ cells (light blue) were significantly different from each other (rank-sum, p=0.0048). Dark/light squares indicate units for which the y-intercept was/was not significantly different from 0, respectively. Lines indicate population medians and lower/upper quartiles.