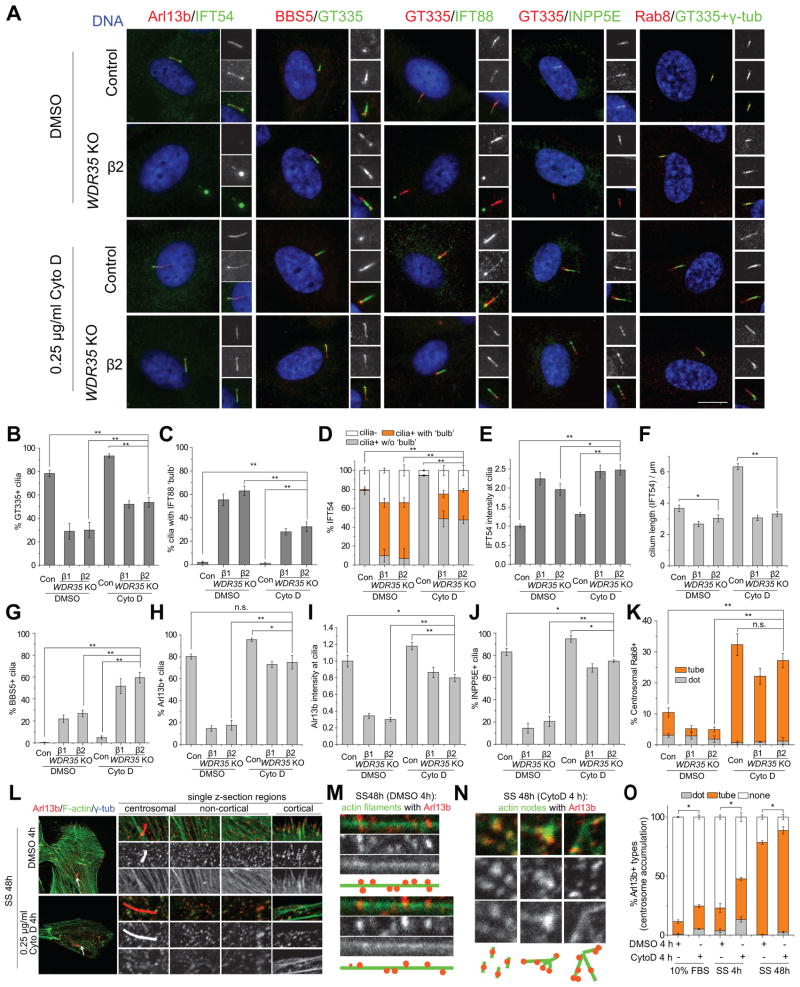
Figure 4. The actin network antagonizes cargo transport.
(A) Control and WDR35 KO cells treated with DMSO or 0.25 μg/ml Cytochalasin D for 24 h were visualized with antibodies against cilium markers, GT335, IFT54, IFT88, BBS5, and Arl13b. Representative immunofluorescence images are shown. Scale bar, 10 μm. (B–K) Quantification of cilium markers as in (A). GT335+ cilia (B), cilia with IFT88+ ‘bulb’ (C), IFT54 localization at cilia (D), relative IFT54 immunofluorescence intensity at cilia (E), cilium length measured by IFT54 (F), percentages of BBS5+ cilia (G), percentages of Arl13b+ cilia (H), Arl13b intensity at cilia (I), percentages of INPP5E+ cilia (J), and percentages of centrosomal Rab8 types (K) were analyzed. Asterisks in (D) indicate significance of occurrence of the bulbous IFT54. (L) RPE1 cells starved for 48 h (and treated with DMSO or CytoD for the final 4 h) were stained with anti-Arl13b antibodies and phalloidin-FITC. Representative single z-sections of different cellular regions are shown. Arrows indicate centrosomes visualized by γ-tubulin. (M and N) Visualized Arl13b-actin complex types in non-cortical regions as in (L). Both representative images and their illustrated cartoons are shown. Arl13b associated with long actin filaments when treated with DMSO (M) while co-localize with small actin nodes with CytoD treatment (N). (O) Arl13b-positive (Arl13b+) structures (dot/tube) around centrosomes were counted in RPE1 cells with DMSO or CytoD treatment as indicated. Asterisks indicate significance of occurrence of total Arl13b+ structures. Data in (E), (F) and (I) are presented as mean ± SEM, and others are shown as mean ± SD. **P < 0.01; *P < 0.05; n.s., not significant. See also Figures S5 and S6.

