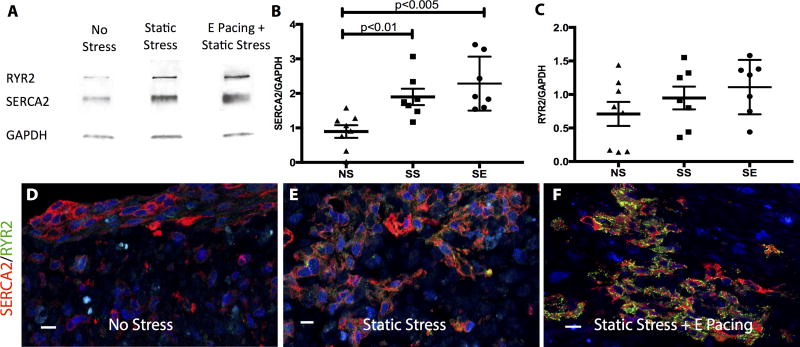
Figure 5.
Increase in calcium handling protein expression by stress conditioning and electrical stimulation. A, Western blot of SR-related proteins, SERCA2 and RYR2, from constructs subjected to different conditioning regimes. B&C, Dot plot of quantified western blot data. Data are normalized to internal control (GAPDH). B, Compared to the NS control, SS conditioned constructs increase SERCA2 expression by 2-fold (NS vs SS, p<0.01) and SE-conditioned constructs by 2.5-fold (NS vs SE, p<0.005). C, An increasing RYR2 expression trend is observed from NS to SE constructs but did not reach statistical significance. n=8 for NS, n=7 for SS, and n=7 for SE. Representative immunostaining images of engineered cardiac tissues stained with SERCA2 (red) and RYR2 (green) from NS (D), SS (E) and SE (F) conditionings. The scale bar is 10 μm.

