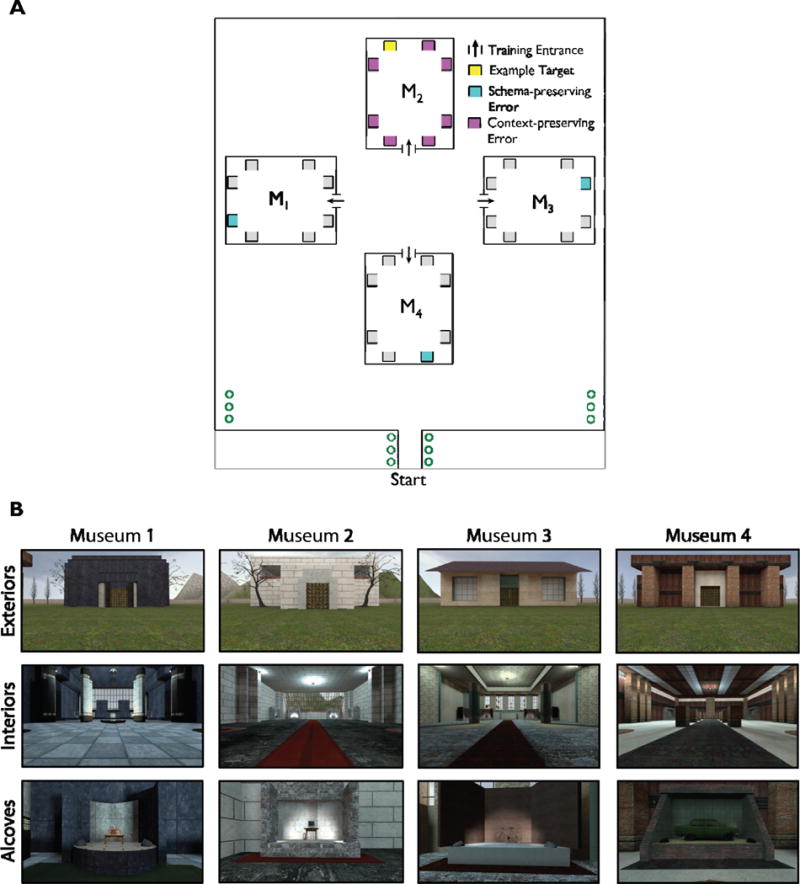
Figure 1.

Map and images of the virtual environment. A. Map of the virtual park and the four museums used in Experiment 1. Each museum was oriented at a unique direction with respect to the surrounding park. Objects were displayed within alcoves, which are indicated by grey squares. Each alcove could only be viewed from one direction. The yellow alcove represents an example target object; cyan alcoves represent schematic errors for this target; magenta alcoves represent contextual errors for this target. B. Images of the four museum exteriors, interiors, and an example object in an alcove.
